Chapter 2 - Biology basics and measuring biology
Contents
Chapter 2 - Biology basics and measuring biology#
Here I have set out to outline following things:
Basics of (longevity) biology.
Quantifying biological research in longevity.
Tools for measuring the data.
Data sources specifically dedicated to aging.
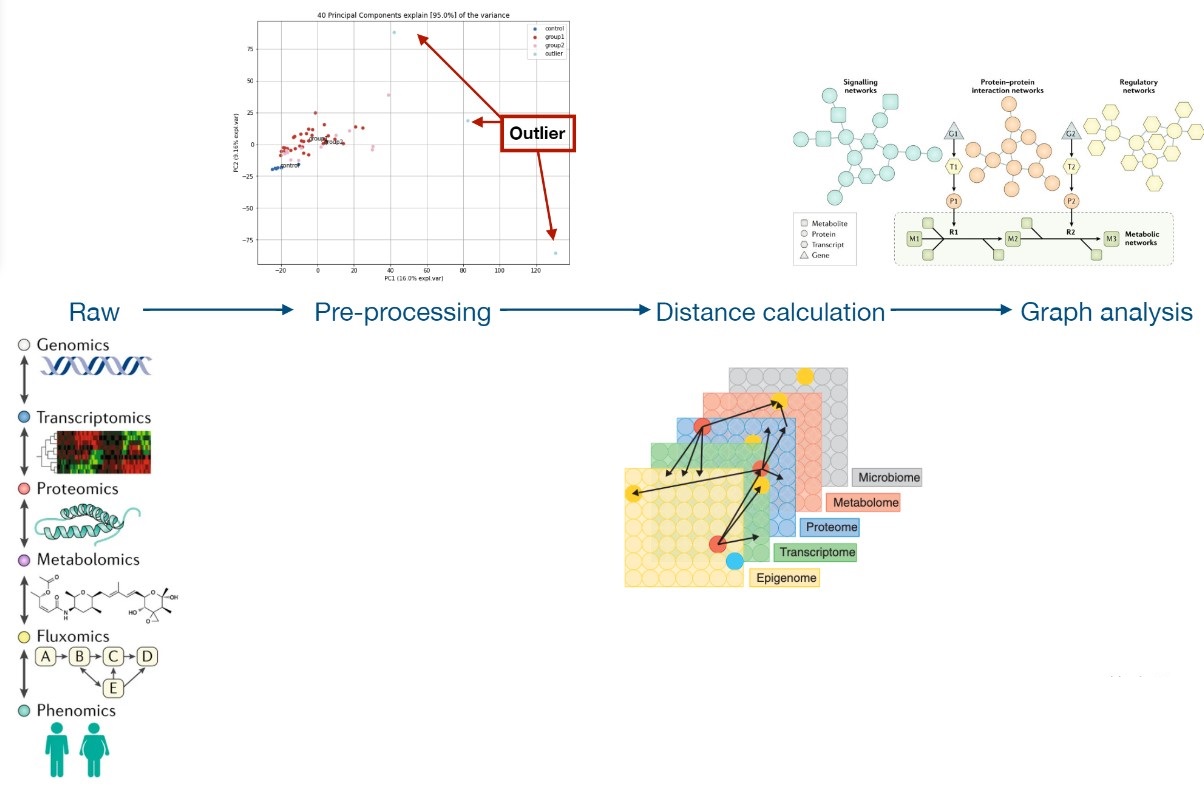
Network and omics approach to research aging.
Cell, as a basic unit of life, contains answers to all of the life questions, including longevity.
Studying the cell is a good start to tackle longevity.
Essentials of Cell Biology provides a great introduction. Here I will try to briefly reiterate definitions that are relevant.
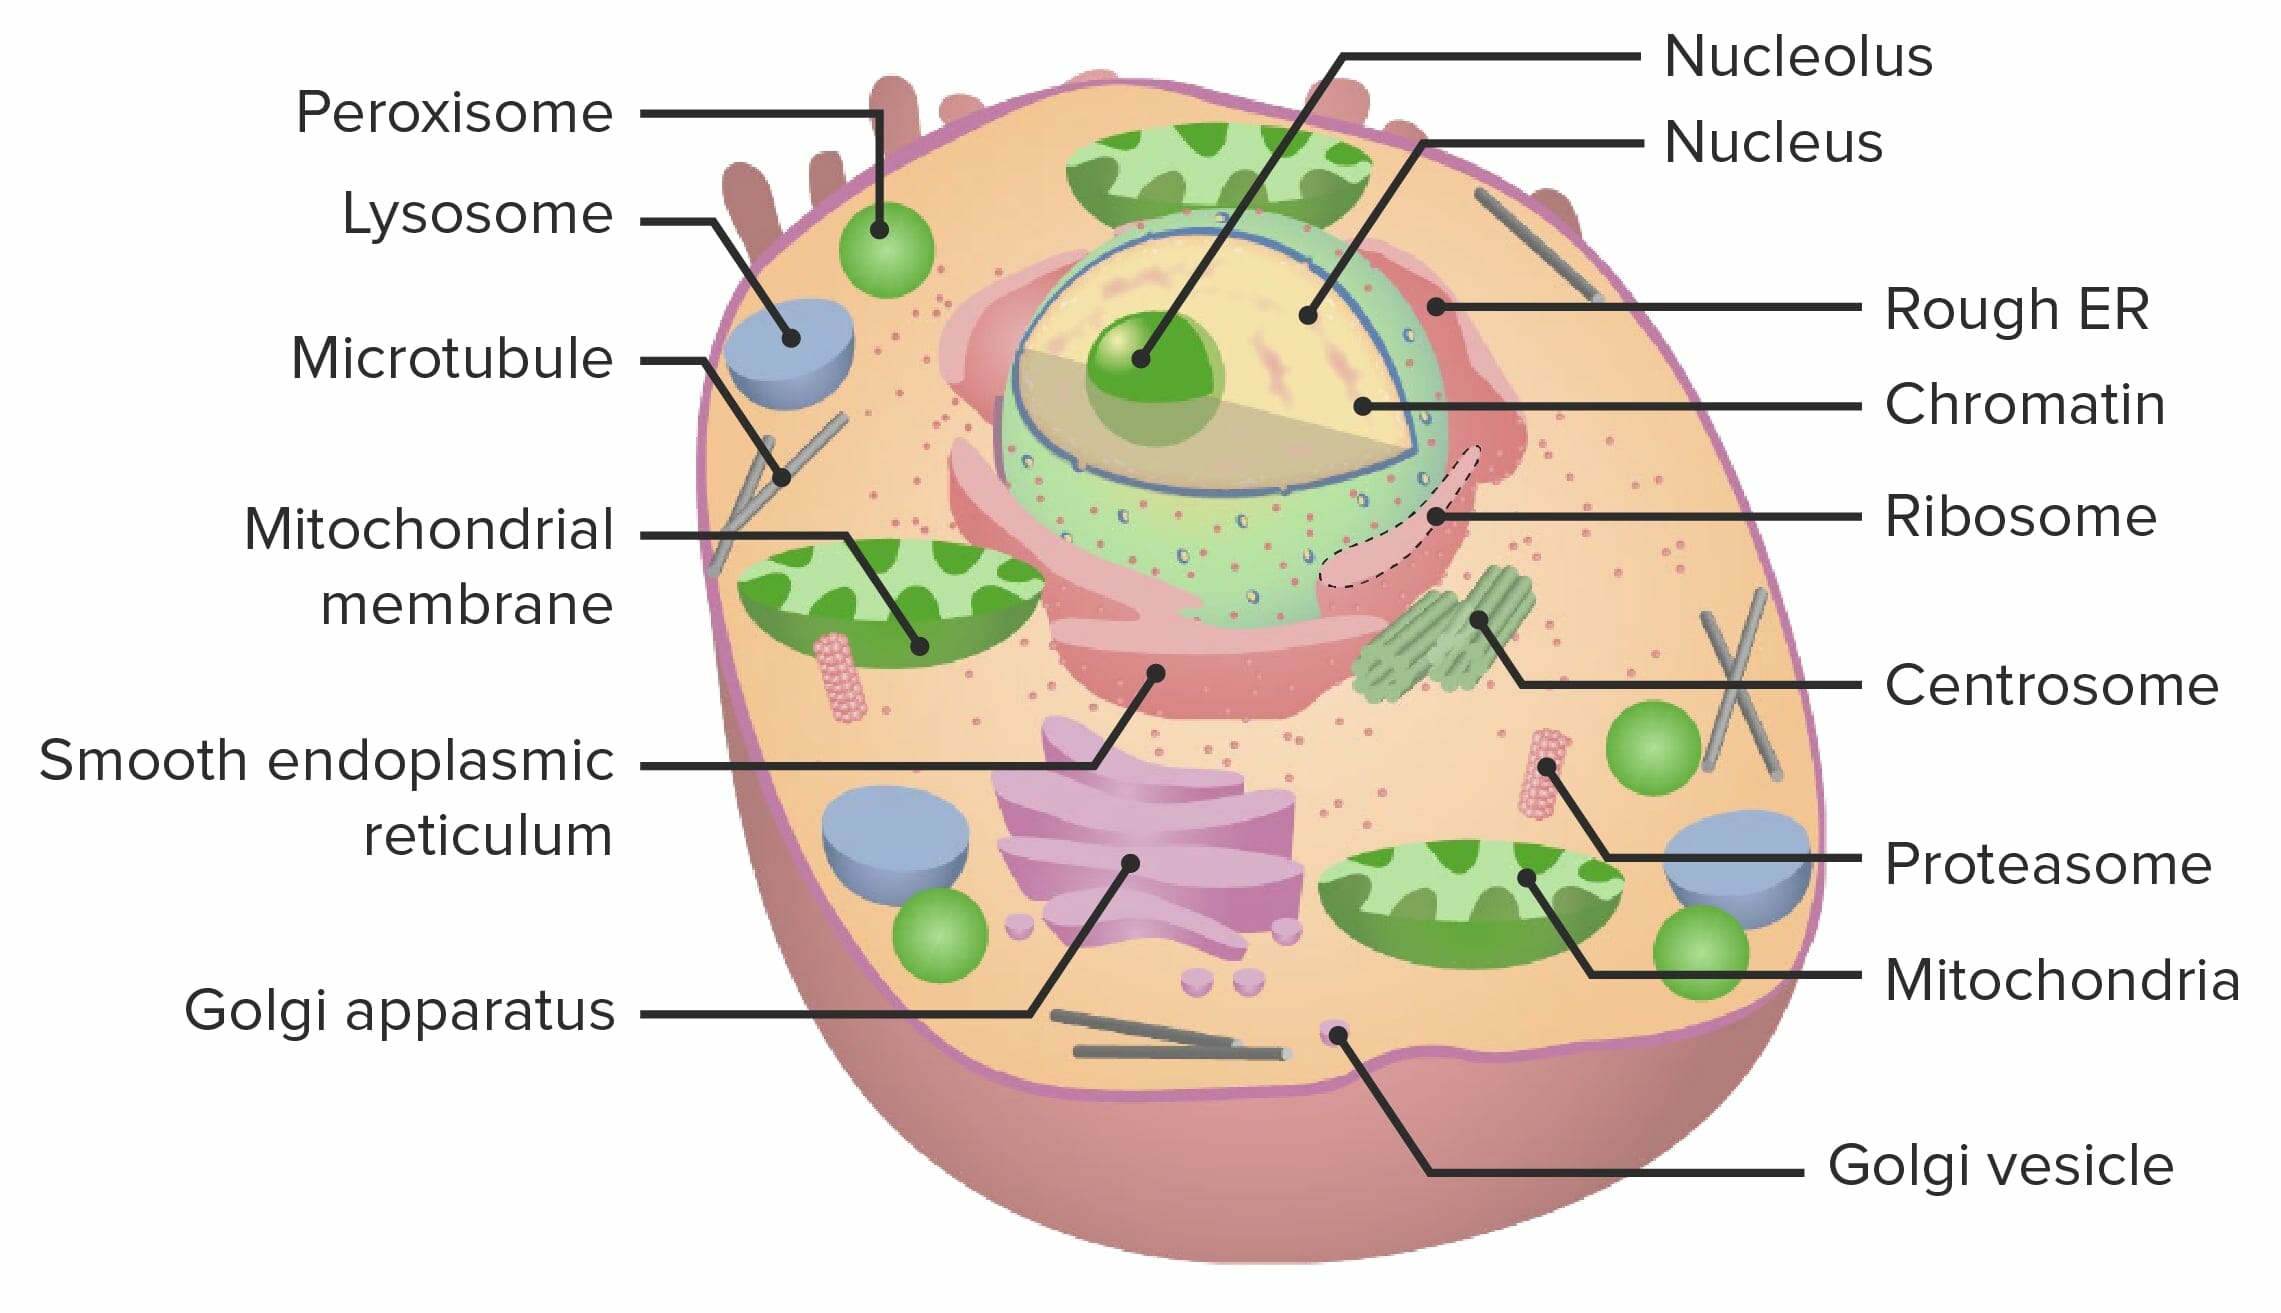
Proteins are responsible for structural, transport, signaling and storage roles. Additionally they are functional components of the cell, acting as enzymes — molecular machines that catalyze reactions.
Small molecules is a low molecular weight organic compound that may regulate a biological process, with a size on the order of 1 nm. Some examples are phenolic compounds, alkaloids and sugars.
Nucleic acids represent information, with DNA encoding genetic information and RNA playing multiple roles. Messenger RNA carries information from DNA to ribosomes. molecular machines partially constructed from RNA themselves, which synthesize proteins by translating nucleotides into amino acids.
Water, small molecules and inorganic ions.
Carbohydrates used for nutrients, energy storage and some cases, such as cellulose in plants, providing cell structure.
Lipids used for energy storage, signaling and cellular membranes.
Genes#
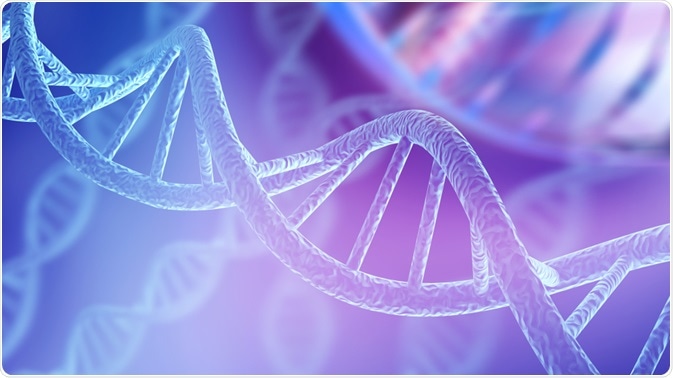
DNA is a double-helix structure composed of two chains of nucleotides (adenine, thymine, guanine, cytosine, or ATGC). Within this structure, different sections, known as genes, perform specific functions. These genes can be further divided into codons, which are sequences of three nucleotides, such as ATG. Understanding the structure and function of DNA is essential for fields such as genetics and molecular biology.
Transcription#
:max_bytes(150000):strip_icc():format(webp)/protein_synthesis-114c6e97b3494f04abc60643d7fda11a.jpg)
The process of gene expression involves the conversion of DNA sequences into functional proteins. This process begins with the enzyme RNA polymerase, which copies the DNA sequence into a single strand of RNA known as pre-mRNA. This strand of RNA is then modified to become messenger RNA (mRNA), which carries the genetic information needed to produce proteins.
Pre-mRNA contains both “useful” sections, known as exons, and “separator” sections, known as introns. The introns are removed from the pre-mRNA by a complex association of proteins called the spliceosome, resulting in the formation of mRNA. This process is not always the same, as different mRNA sequences can be produced depending on how the splicing occurs. This variation can ultimately lead to the production of different proteins from the same gene.

Translation#

The process of gene expression involves the translation of nucleotide sequences in DNA and RNA into functional proteins. Messenger RNA (mRNA), which carries the genetic information needed for protein synthesis, is transcribed from DNA and transported into the cytoplasm of the cell. In the cytoplasm, the mRNA is read by transfer RNA (tRNA) and used to assemble a chain of amino acids in the order dictated by the nucleotide sequence. These amino acid chains will then fold and interact to form a protein.
The sequence of nucleotides in DNA ultimately determines the sequence of amino acids in a protein and the protein’s final three-dimensional structure. However, predicting this structure from the DNA sequence is a difficult problem. Additionally, once a protein is produced, it can interact with the DNA and regulate its activity, giving rise to the field of epigenetics. This process is known as the central dogma of molecular biology, although the reality is more complex.
Gene expression regulation#
Gene expression is the process by which the genetic information encoded in DNA is used to produce functional proteins. Not every gene is expressed in every cell, and the regulation of gene expression allows cells to perform different functions and develop specialized characteristics. Gene regulation can occur at various stages in the process of gene expression, including before transcription, during transcription, during translation, and post-translation.
Epigenetics is the study of changes in gene expression that are not caused by changes in the DNA sequence. These changes can be influenced by internal or external signals, and can affect gene expression at the level of transcription. Transcription factors, proteins that bind to specific genes, can also regulate gene expression by promoting or suppressing the transcription of mRNA.
During translation, the process of converting mRNA into amino acid chains, gene expression can be regulated by interfering with the availability of mRNA or the process of protein synthesis. This can be achieved through mechanisms such as RNA interference, which reduces the activity of a gene by reducing the lifespan of the mRNA it encodes.
Post-translationally, proteins can be modified by attaching chemical groups, such as phosphoryl or ubiquitin groups. These modifications can either increase or decrease the activity of a protein, depending on the specific protein and modification. Overall, the regulation of gene expression is a complex and essential process that allows cells to perform specific functions and maintain the overall health and function of an organism.
Epigenetics#
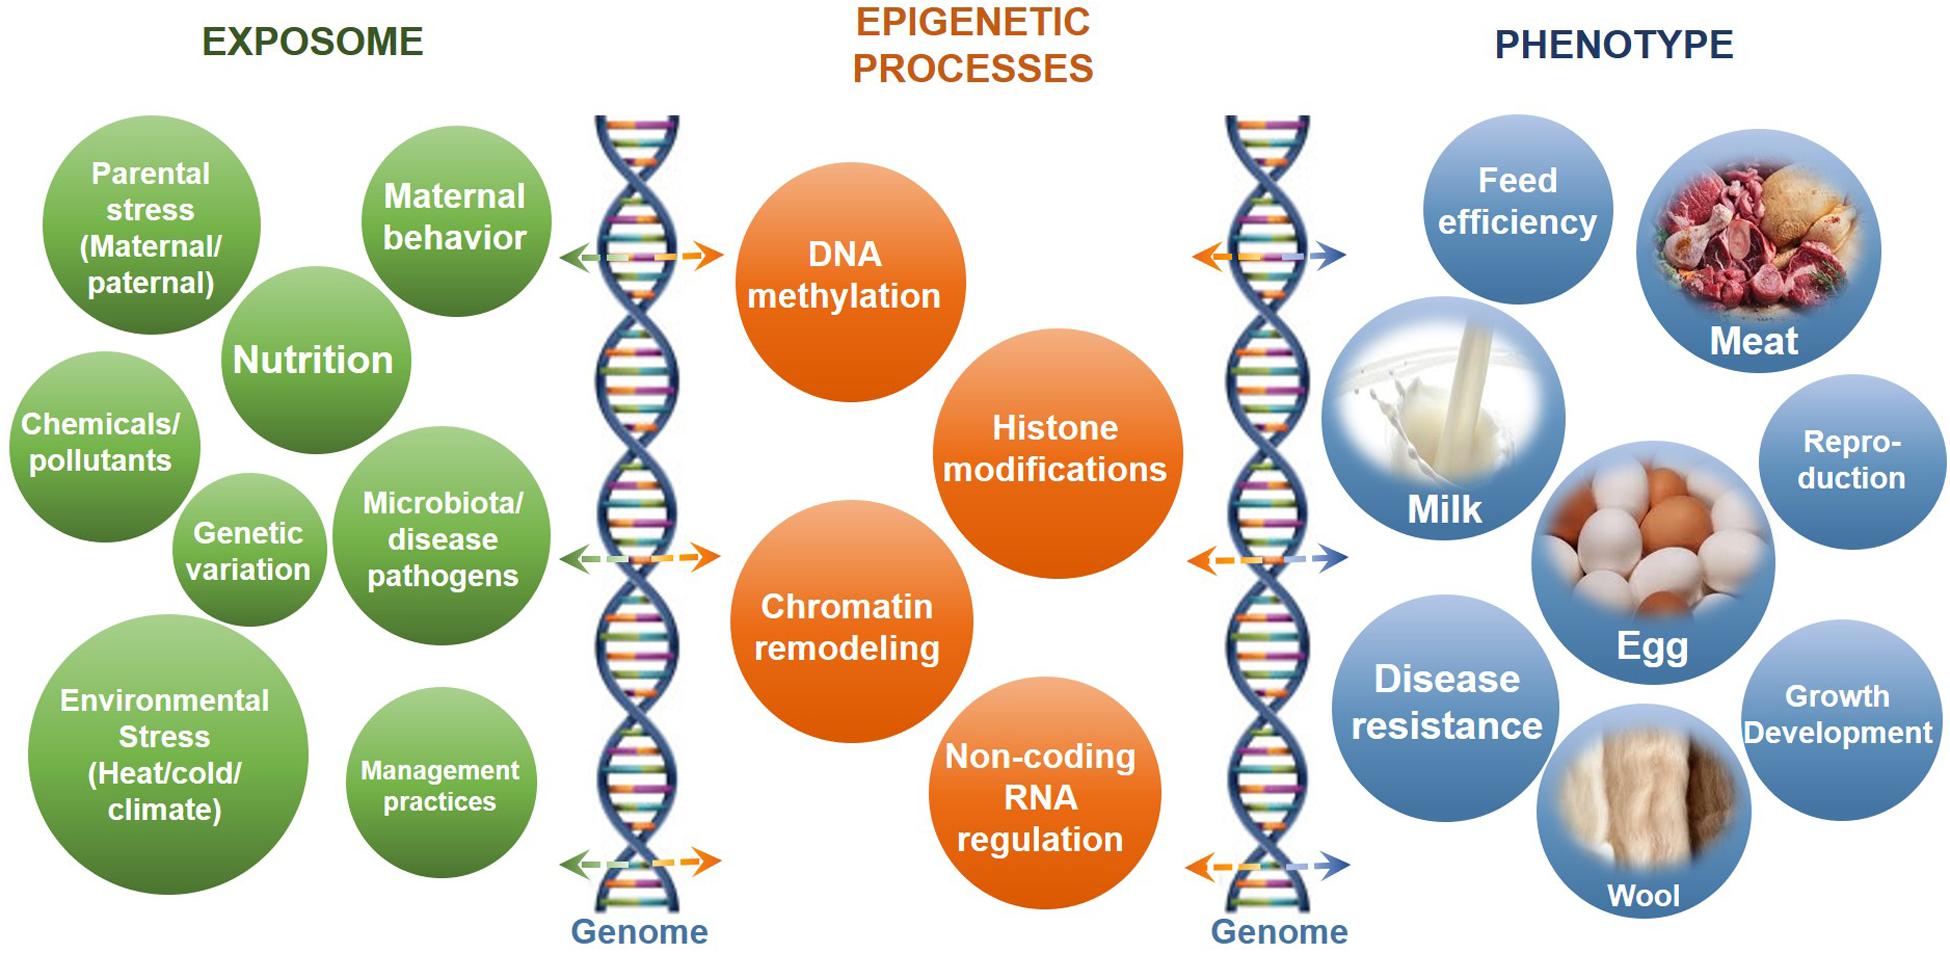
The genetic code contained in DNA can be interpreted in different ways to produce different cellular characteristics. This is achieved through a process known as epigenetics, which involves the modification of DNA and associated proteins without changing the underlying nucleotide sequence.
The DNA double helix is wrapped around histone proteins to form the chromatin molecule. Both the DNA nucleotides and the histones can be chemically modified, and these modifications can affect gene expression. For example, the addition of methyl groups to DNA nucleotides can prevent transcription of the gene. Histone modifications can also act as promoters or repressors of gene expression. Other forms of epigenetic modifications, such as acetylation, can facilitate gene expression by making the chromatin more accessible.
The formation of heterochromatin, a tightly packed form of DNA that inhibits transcription, is another mode of epigenetic regulation of gene expression. Overall, epigenetic modifications allow cells to respond to their environment and develop specialized characteristics.
It seems like the relevance of epigenetics to aging is higher than it was thought years ago. (Pal and Tyler (2016), Kane and Sinclair, (2019)), and David Sinclair in particular defends a theory of aging that puts it at the core of the issue.
Chromosomes telomeres and telomerase#
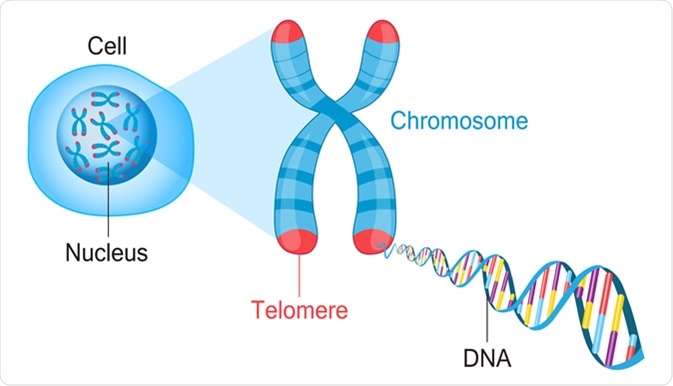
Inside the nucleus of a cell, the genetic material is typically found in an uncoiled state, facilitating its interaction with other proteins. Chromosomes, which are structures formed from tightly packed DNA, are generally not visible under normal conditions. They become visible when the cell is preparing to divide.
At the ends of chromosomes, there are structures called telomeres, which consist of repeated nucleotide sequences. In humans, these sequences are TTAGGG. The telomeres are protected by a complex of proteins known as shelterin, which prevents the cell’s DNA repair machinery from recognizing the ends of the chromosomes as breaks. If the shelterin complex is removed, the cell will recognize the telomeres as DNA damage and either commit cellular suicide (apoptosis) or enter a state known as senescence, in which it stops dividing.
During cell division, the telomeres end up as caps on the arms of the chromosomes. However, the process of DNA replication is not perfect, and the telomeres shorten by about 50 base pairs with each round of cell division. Eventually, the telomeres become too short to maintain their protective structure, leading to the recognition of DNA damage and the activation of cell death pathways. The number of times a cell can divide before this occurs is known as the Hayflick limit.
It’s important to note that cells rarely reach a point where there is no telomere left at all. At birth, telomeres are around 10 kilobases long and they shorten by approximately 25 base pairs each year. This means that in theory, a cell has enough telomeres to survive for 400 years, assuming that there is no other damage to the telomeres. However, cells typically undergo apoptosis or senescence before reaching this point. Therefore, while running out of telomeres is the ultimate failsafe mechanism, it is more common for telomeres to accumulate enough damage to trigger cell death. Telomeres can therefore be thought of as a way to measure the overall damage in a cell.
It’s also worth mentioning that some cells, such as stem cells that produce red blood cells, replicate a lot and their telomeres are not long enough to last throughout a person’s lifetime. For these cells, there is an enzyme called telomerase that can lengthen the telomeres. Telomerase is made up of two core proteins, encoded by the TERT and TERC genes. This is the reason why some healthy habits are claimed to “lengthen telomeres”. While it is technically possible for telomerase to lead to longer telomeres in the population of certain cells, for most cells, telomere length can only ever shorten.
Telomeres, the protective caps at the ends of chromosomes, play a critical role in the suppression of cancer. When a cell replicates too quickly, it will exhaust its telomeres and die. However, if telomerase, the enzyme that lengthens telomeres, becomes active or the alternative lengthening of telomeres (ALT) mechanism is utilized, cancer may develop. Mutations in telomerase or abnormalities in telomeres have been linked to diseases such as pulmonary fibrosis and dyskeratosis congenita. However, for the general population, telomere length is not a strong predictor of illness.
Mitochondria and oxidative stress theory#
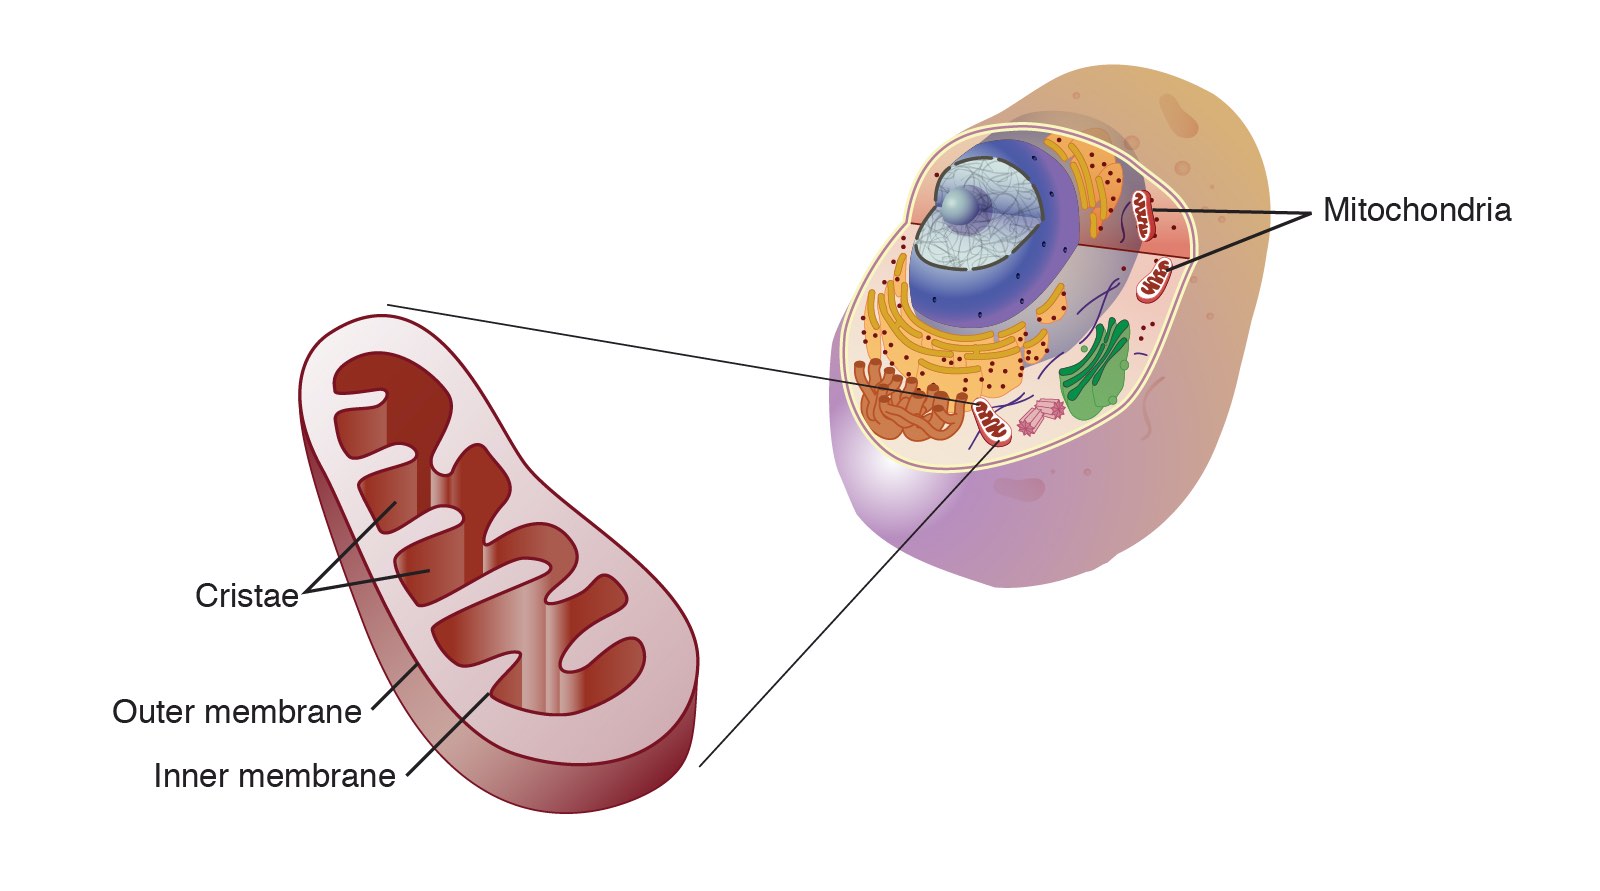
Reactive Oxygen Species (ROS)
Reactive oxygen species (ROS) are known to cause damage to cellular structures, including telomeres, leading to cellular senescence and aging. However, David Sinclair’s book “Lifespan” suggests that this is not a widely accepted theory in the field, as studies have shown that antioxidant intake does not prolong life and deletion of antioxidant-generating genes does not reduce lifespan. Some studies have suggested that ROS may not be directly involved in lifespan, but may impact healthspan or have more significant effects when oxidative stress is chronic rather than acute.
The oxidative stress theory of aging proposes that reactive oxygen species (ROS), which are produced as a byproduct of ATP production in mitochondria, can cause damage to DNA and other cellular components, leading to aging and age-related diseases. However, the theory has been controversial, with some studies suggesting that ROS do not play a significant role in aging and that they may even have a signaling function. In recent years, researchers have argued that while ROS may not cause indiscriminate damage, they may still contribute to aging if they are produced at high levels or in response to chronic stress. The evidence supporting the theory remains mixed and further research is needed to fully understand the role of ROS in aging.
Ren & Zhang (2018) note the existence of the “ROS and aging paradoxes” where there are evidence and theoretical arguments supporting and undermining a role for ROS in aging. They ascribe this to poor measurement and compensatory mechanisms (the antioxidant pathways being more redundant than it is thought).
Barja (2019) pushes back against the role of ROS as signaling molecules and again reasserts that the weight of the evidence is on the side of the oxidative theory.
Finally in a 2019 review, Munro & Pamenter admit as of today no consensus has been reached, and they call for better measurement techniques. The authors even question the idea that mitochondria are even net sources of ROS (!). Where they say that there is consensus is that ROS damage to proteins floating around in the cytosol is not a driver of aging, but damage to the mitochondria may be.
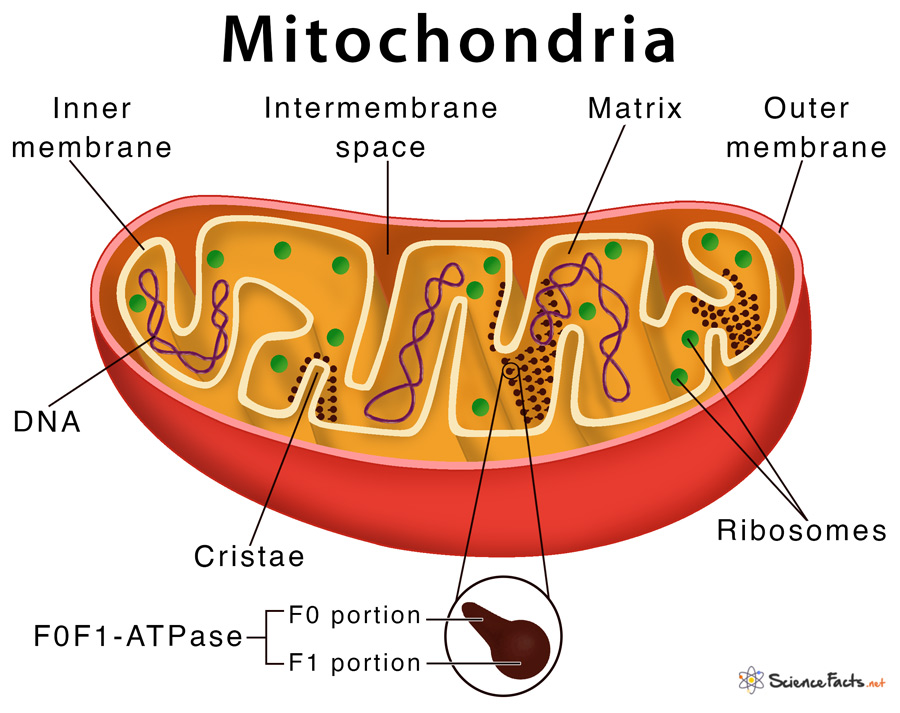
Mitochondria are the powerhouses of the cell, as they are responsible for generating energy through the production of ATP. They are organelles enclosed in a double membrane, and are the only organelles that have their own DNA, called mitochondrial DNA. The regular nuclear DNA has genes that code for the ~1000 proteins that mitochondria need, except for 13 of them which are made in-situ in the mitochondria. Mitochondria are constantly being created and destroyed, and can also merge to form larger units.
Mitochondria generate energy by creating a proton gradient between their double membranes. A set of molecular machines called complexes I-V pump the protons into the gradient, which are then discharged through a rotating molecular turbine called ATP synthase that converts ADP into ATP. Cells also use other methods of generating energy, primarily through the breakdown of glucose into pyruvate, releasing ATP in the process. The pyruvate then enters the mitochondria where the complexes I-V pump protons into the double membrane. During these processes, the mitochondria use a molecule called NAD as a helper, which exists in two forms: NAD+ and NADH.
Cellular senescence#
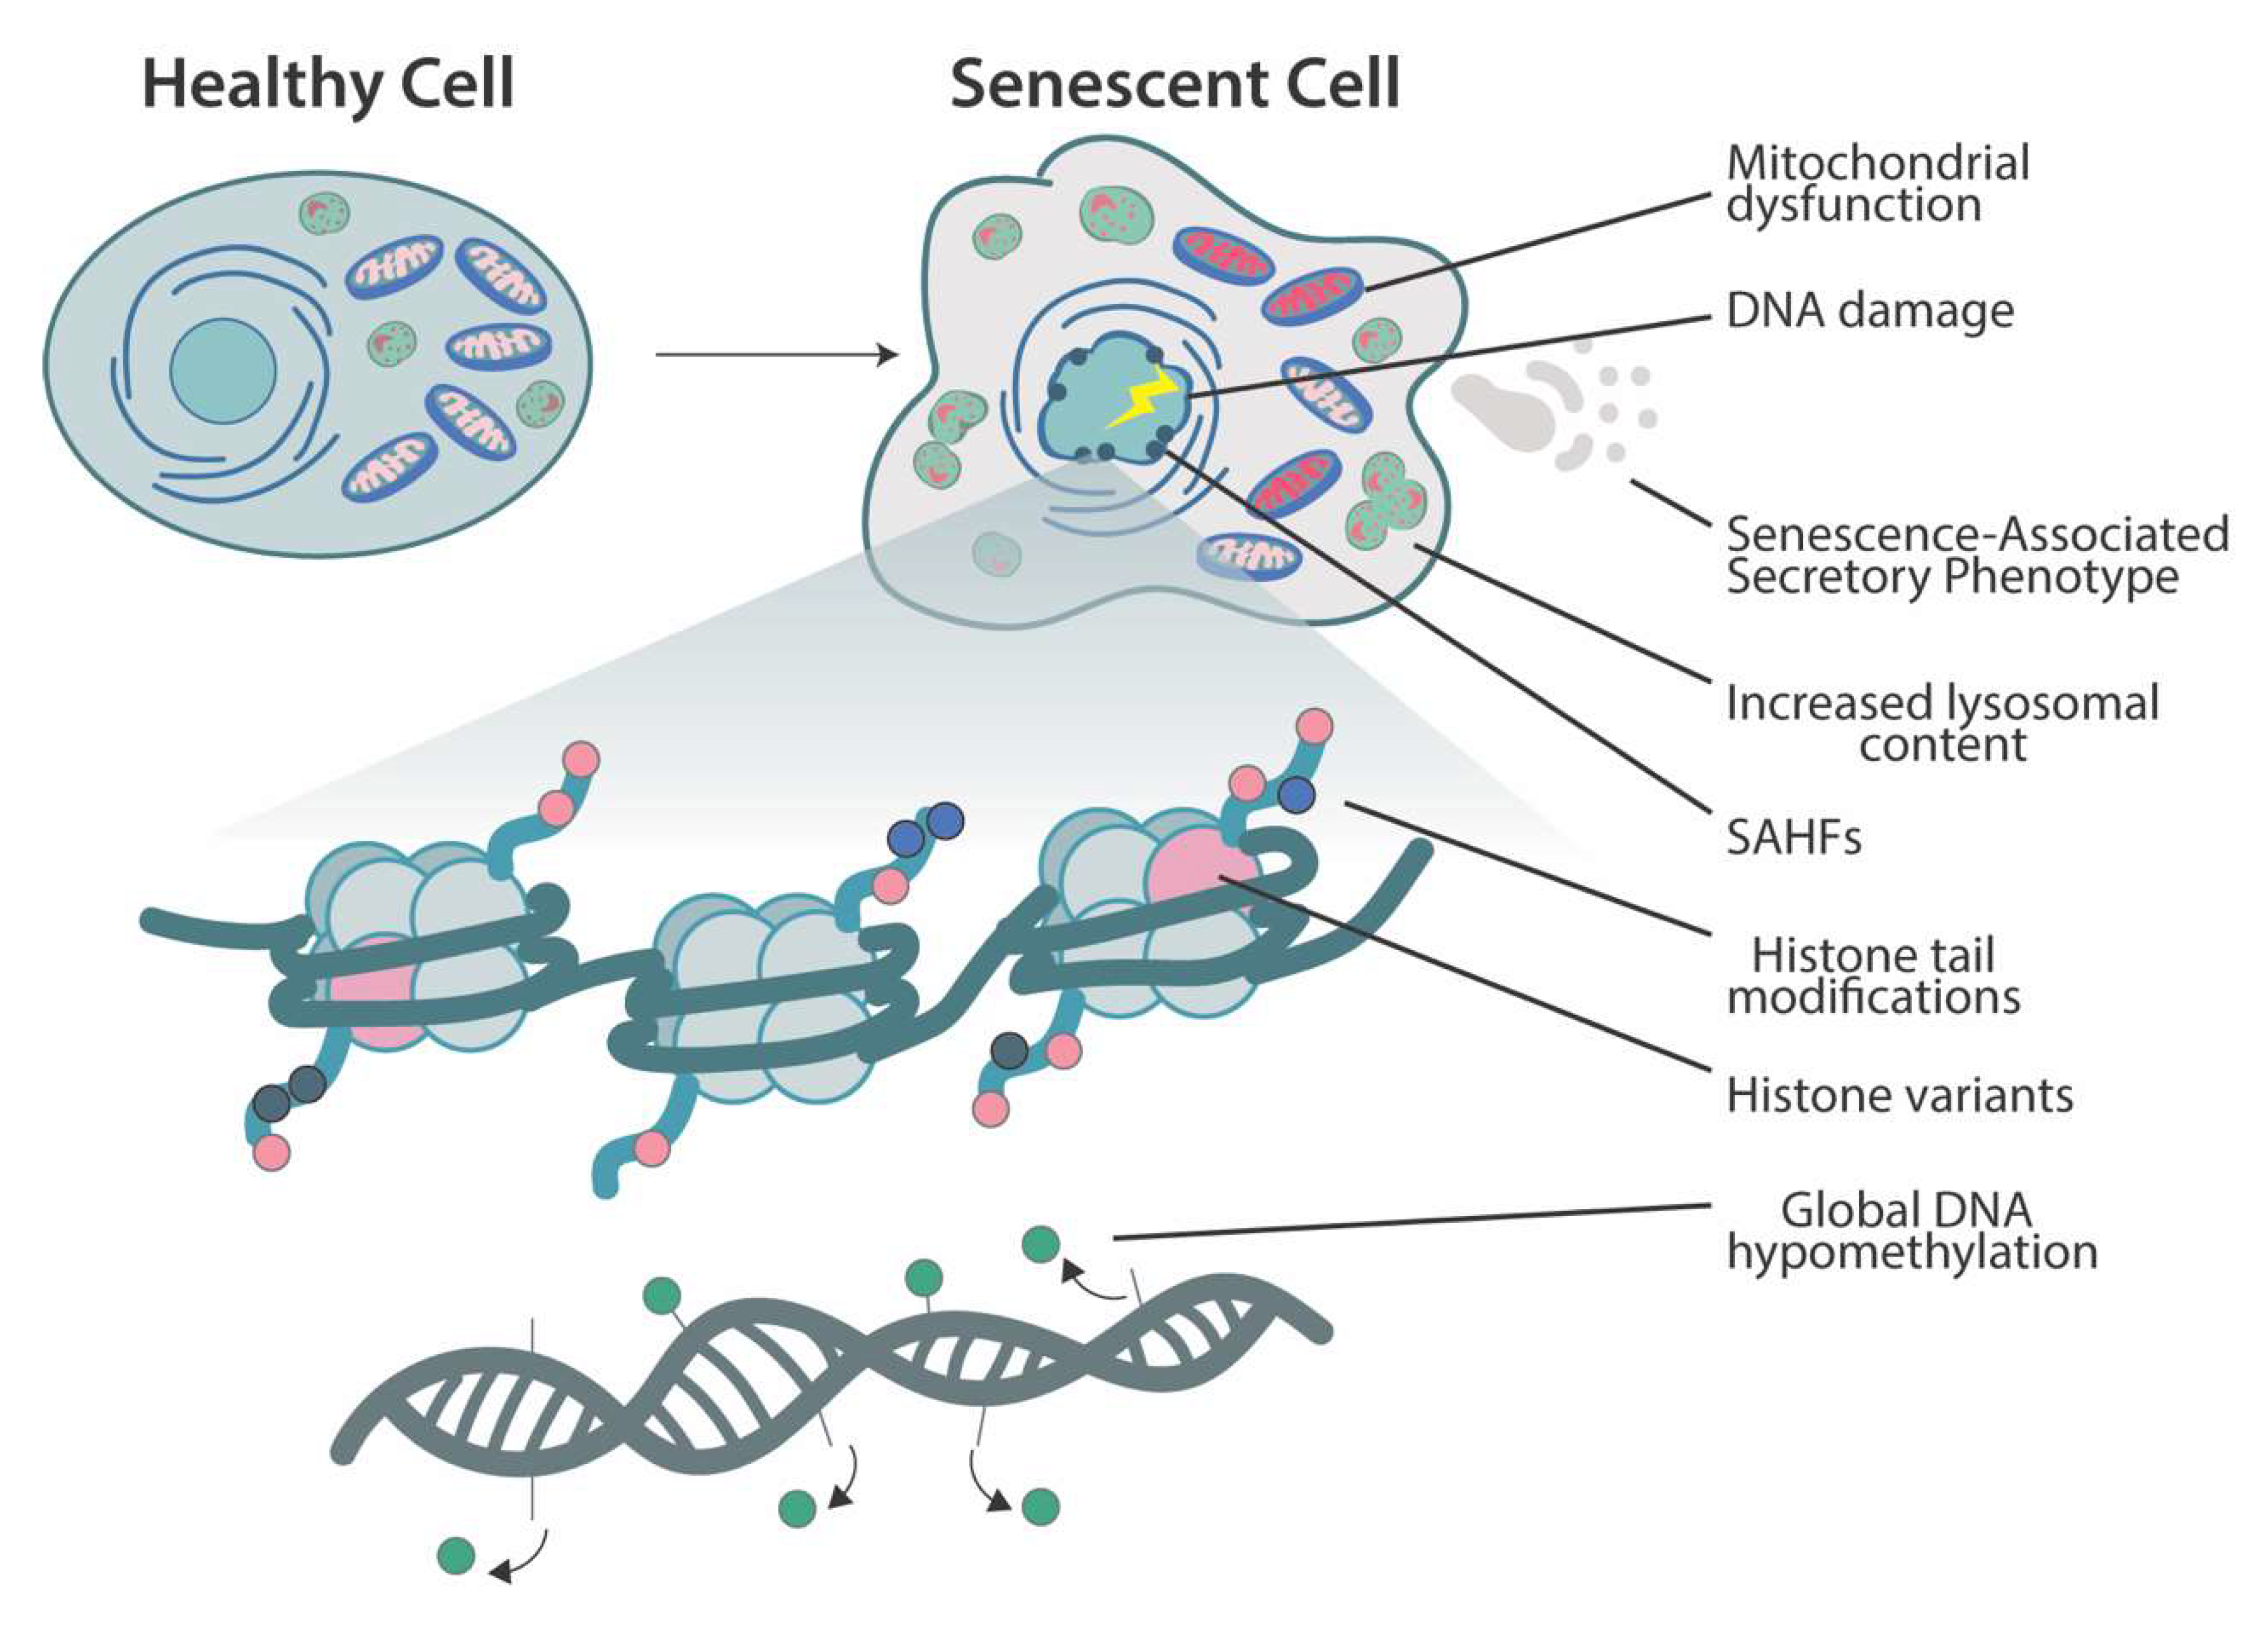
Senescent cells are a type of damaged cell that have entered a state of arrest and no longer divide. These cells can either undergo apoptosis and be recycled, or stick around and release a Senescence-Associated Secretory Phenotype (SASP) that signals to the immune system to clear them. In small amounts, this SASP can have positive effects on tissue repair and wound healing. However, in large quantities, senescent cells can cause inflammation in nearby cells, increasing the risk of cancer and promoting aging. A protein called p16INKa is commonly expressed in senescent cells and can be used to identify them in vitro. However, it is difficult to distinguish senescent cells from healthy cells externally. Research suggests that there may be different types of senescent cells, some with positive effects and others with negative effects. Transplanting even a small amount of senescent cells into mice has been shown to reduce their lifespan and overall health.
Quantifying biological research in longevity#
Once we have a very basic understanding of basic unit of life, the cell, next interesting question becomes:
What can we measure about different processes happening inside of the cell?
After all, if we can measure it, we can computationally tackle it.
In molecular biology, as previously stated, the flow of genetic information is classically described by the Central Dogma, stating that genetic code is transcribed into RNA, which is in turn translated into proteins. These are the functional units which maintain cellular homeostasis and the source of cell type specific functions. Recently, developments in the fields of epigenetics and metabolomics have significantly challenged the Central Dogma. The genetic architecture was shown to directly affect genetic activity while the metabolism, previously thought of as one of the final outputs of the genome, was found to be a major source of input and genetic regulation by acting as an environmental sensor. This indicates that focusing on a singular source of omics data might not give a full picture.

General Measurament tools#
I am going to name a couple of prominent methods important for capturing information on different levels, from proteomics to genomics.
Sequencing — reads the structure of DNA and RNA.
qPCR — Real Time polymerase chain reaction, which monitors amplification of DNA with help of fluorescence. Useful for diagnostics, quantification of gene expression.
Antibody-based Methods — Western Blots, ELISAs, and multiplex assays to analyze the presence and quantity of proteins.
X Ray-crystallography and Cryo-EM — For structural biology, identifying the structure of molecules and proteins, including detail such as conformation and location of atoms.
Sequencing#
Sequencing techniques, such as DNA and RNA sequencing, are widely used in research to study genes and their functions. These techniques involve decoding the sequence of bases in nucleic acids, which can provide insight into gene expression and regulation. The cost of sequencing has dramatically decreased in recent years, making it a valuable tool in understanding cellular state and function. There are various technical approaches to sequencing, each with its own benefits and limitations. Scientists choose the appropriate approach based on their research goals, as well as cost and error rate.
DNA sequencing has huge value in research as it allows us to study genes, including their differences between biological species, and with help of bioinformatics software attempt to map them to function and phenotypes. RNA sequencing allows us to understand transcription, or which genes are expressed in different cell types. Beyond this, sequencing is also used indirectly to study methylation, chromatin binding, or even perform protein assays with help of custom DNA adapters to antibodies. Overall, these tools help us better understand cellular state and function.
There are many different technical approaches to sequencing such as sequencing by synthesis done by Illumina, where a fluorescent signal is emitted and read every time a nucleotide is added; or detecting ionic current changes as DNA strand passes through a protein channel in a device membrane, as in Oxford Nanopore. Scanning a DNA strand this way generates a “read”, which depending on the technology provider is either short (~150–200 bases, Illumina) or long, such as 1500 bases+. Scientists pick the approach based on their goals, as well as cost and error rate:
Short reads (Illumina, Ion Torrent, BGI Genomics) are often cheaper and have low error rates, often under 0.5% per base. They are great for detecting SNPs/variations which could cause a disease, but make it harder to build the whole genome without reference.
Long reads (Pac Bio, Oxford Nanopore) approaches have higher error rates and are generally better for de-novo construction of the genome. This can make them better for metagenomic analysis, which includes sequencing many organisms at once for understanding a given microbiome or studying the population of organisms in a lake.
Ultimately, tens of thousands to millions of such read segments can be generated per run producing gigabytes of data; alignment software tools such as GSNAP or Bowtie 2 are then used to map it to the reference genome. Once reads are mapped, you can check whether there is a difference/mutation in the nucleotides of a given gene and perform other analyses.
qPCR#
Quantitative polymerase chain reaction (qPCR) is a technique used to measure gene expression by quantifying the amount of a specific RNA in a sample. This method uses the polymerase enzyme to amplify a specific DNA sequence of interest, which is made detectable by a thermocycler that denatures the DNA and allows the enzyme to copy the region defined by the primer sequences. This results in a billion-fold amplification of the specific sequence of interest. In qPCR, the RNA in the sample is first converted into DNA using reverse transcriptase, and then regular PCR is performed on the resulting cDNA. The abundance of the cDNA is detected using fluorescence, which corresponds to the level of expression and can be visualized in amplification curves. This technique is commonly used in experiments to compare gene expression after a gene knockout or pathway modification, or in diagnostic tests to detect the presence of a particular virus.
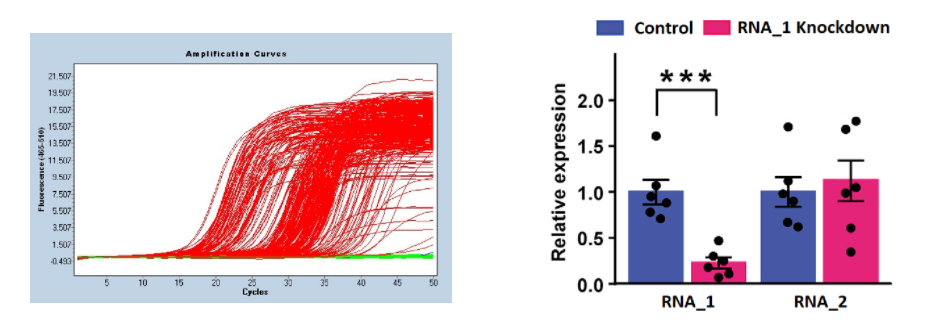
Gene expression results of qPCR might be reported in a scientific paper with an illustration similar to the one above, where RNA_1 expression was knocked down, potentially with help of a viral vector or short hairpin RNA, while a different RNA_2 is not affected.
Antibody-based Methods#
Protein quantification methods are commonly used in scientific research and diagnostics to detect and measure proteins and other molecular structures. These methods often utilize specific antibodies that are conjugated with unique DNA strands, beads, or enzymes for detection. Two classical techniques that are still widely used in research are Western blotting and ELISA (enzyme-linked immunosorbent assay). Western blotting is used to detect specific proteins in a sample by separating proteins by size and transferring them to a membrane, where they are then detected with a specific antibody. ELISA uses a specific antibody to detect a protein in a sample by binding the protein to a plate, followed by a detection step with a second antibody.
More advanced modern techniques include multiplexed immunoassays, which allow for the detection of multiple proteins in a single sample, and mass spectrometry-based proteomics, which enables the high-throughput analysis of large numbers of proteins in a sample. Protein quantification is important for understanding the mechanisms of cell function and for detecting diseases such as heart disease.

Western blotting is a common and relatively inexpensive method for detecting proteins. This technique uses gel electrophoresis to separate proteins based on their molecular weight or charge, followed by the detection of the proteins using specific antibodies. Western blots are semi-quantitative, as the size of the protein band can be used to infer its abundance, but precise quantification is difficult. When necessary, the protein band can be cut out of the gel for further analysis, such as mass spectrometry. This method is commonly used in scientific research and is often visualized as a vertical gel image in scientific papers.
ELISA, or enzyme-linked immunosorbent assay, is a plate-based method used to detect and quantify proteins or other substances using antibodies. In an ELISA, when the detection antibody binds to the protein of interest, it remains within the well of the plate; otherwise, it is washed away. Enzymes bound to the remaining antibodies catalyze a color change in a fluorescent reagent, allowing the protein to be detected. ELISAs are often performed using 96-well plates that can be purchased as pre-made kits for a specific protein. Multiple samples and dilution levels can be processed on the same plate, and due to its good sensitivity and broad dynamic range, ELISA is considered the gold standard for protein quantification.
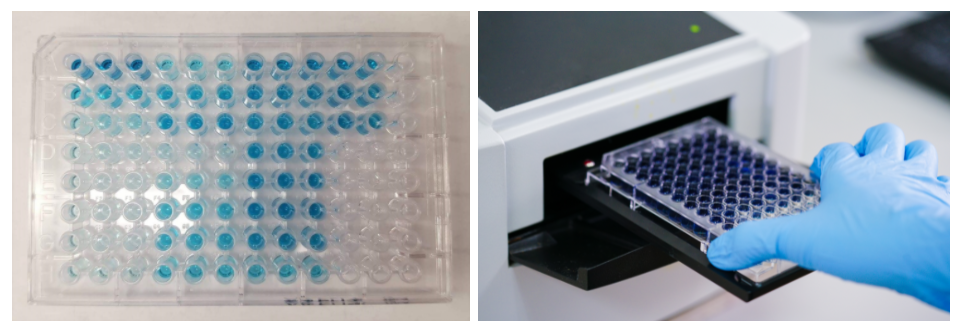
Over the past two decades, there has been significant progress in the development of multiplexing methods, which allow for the simultaneous quantification of many proteins in a single sample. These methods are useful for analyzing protein expression and for more effective diagnostic testing. Two common approaches are bead-based suspension arrays and planar arrays.
Bead-based approaches, such as Luminex, utilize microscopic beads coated with antibodies (2.5 million beads per milliliter) that are mixed with a sample. These beads can be separated based on the unique wavelengths of light they absorb using flow cytometry, which allows for the quantification of each type of protein in the sample.
Planar arrays, such as those used by RayBiotech and FullMoonBio, involve the placement of antibodies in a predetermined pattern on a surface. These antibodies capture molecules and display them as an expression map.
Alternative technologies, such as Olink Explore 1536/384, make use of antibody pairing and DNA hybridization to convert protein binding signals into DNA that can be sequenced. This approach offers high sensitivity and the ability to handle many hundreds of samples per run, but it has limited quantification capabilities due to its reliance on sequencer reads.
Currently, the most sensitive approaches, such as Quanterix Simoa, are able to detect and quantify proteins at the femtogram level, which requires the capture of individual molecules. However, these methods are still limited to 10-plexity per sample and require expensive equipment.
One of the biggest challenges with protein quantification is caused by the high dynamic range of protein concentrations, which can vary by 10^12, making it hard to detect rare low-concentration molecules crowded out by the higher-concentration ones. The other one is the cost and availability of specific antibodies to protein targets: while we have thousands of antibodies, they do not cover the entire human proteome. There are time/ease use considerations as well, as sometimes reagents or steps require hours of preparation and processing.
Nevertheless, this area of proteomics is advancing very fast. A lot of money is going into developing higher plexity and sensitivity methods, coupled with AI will help us diagnose a wide range of diseases early. Because of this I would expect more high-sensitivity multiplex, cow-cost methods to become available over the next few years.
X-Ray Crystallography and Cryo-EM#
X-Ray Crystallography and Cryo-EM are methods for identifying the structure of molecules and proteins, including their conformation and individual atom coordinates. This is important since protein folding shape determines its function.
X-Ray crystallography has been the primary method for solving protein structure with over 150,000 structures in Protein Data Bank, compared to 13,000 for NMR and 6000 for Cryo-EM. It requires formation of crystals with regular internal protein lattice. It then determines the atomic/molecular structure of the crystal by analyzing angles of diffracted x-ray beams, processed to compute chemical bonds and mean positions of atoms.
Cryo-EM reconstruction applies electron microscopy to samples cooled to cryogenic temperatures in vitreous water. Technology broke the 3 angstrom resolution barrier in 2015 with advances in direct-electron detectors, so the number of Cryo EM submissions to PDB has been accelerating in recent years.
One of the benefits of Cry-EM is that it avoids crystallization, which can be very time consuming and difficult to prepare. It is better suited for studying membrane proteins which can be hard to separate for crystallization and larger molecules/protein assemblies typically bigger than 60 kDA in size, as low molecular mass molecules which have fewer scattering atoms contribute less to the signal. X-Ray crystallography tends to be more useful for smaller proteins, also resulting in higher resolution and precision in atomic coordinates, aided by the regular crystal structure. Here is an interesting article on X-rays in Cryo-EM Era.
Data sources#
Now that we have named the tools and the aspects that we want to measure, here are central repositories containing the afromentioned data.
Data sources specifically dedicated to aging#
One of the central resources is HAGR (Human Ageing Genomic Resources) containing data not only commited to the genomic aspects of aging.
GenAge—the ageing gene database.
GenDR—a database of dietary restriction-related genes.
LongevityMap—human genetic variants associated with longevity.
CellAge—a database of cell senescence genes.
AnAge—the database of animal ageing and longevity (Comparative biology).
DrugAge—a database of ageing-related drugs (Chemistry of aging).
Aging Atlas—a multi-omics database for aging biology.
Jaspar—a database of transcription factor binding profiles.
KEGG—a database of molecular pathway maps and categories.
UniProt—a database of protein sequence and functional information
AgeFactDB—a database integrating GenAge and Lifespan Observation DB.
AgeMap—a database integrating gene expression for aging in mice.
GiSAO—a database of genes involved in Senescence, Apoptosis and Oxidative Stress.
Aging Research Portfolio—a databse on aging research world wide.
UniProt—a database of protein sequence and functional information.
NeuroMuscleDB—a database of Genes Associated with Muscle Development, Neuromuscular Diseases, Ageing, and Neurodegeneration.
This study here made a great outline and commentary of different databases and omics approaches.
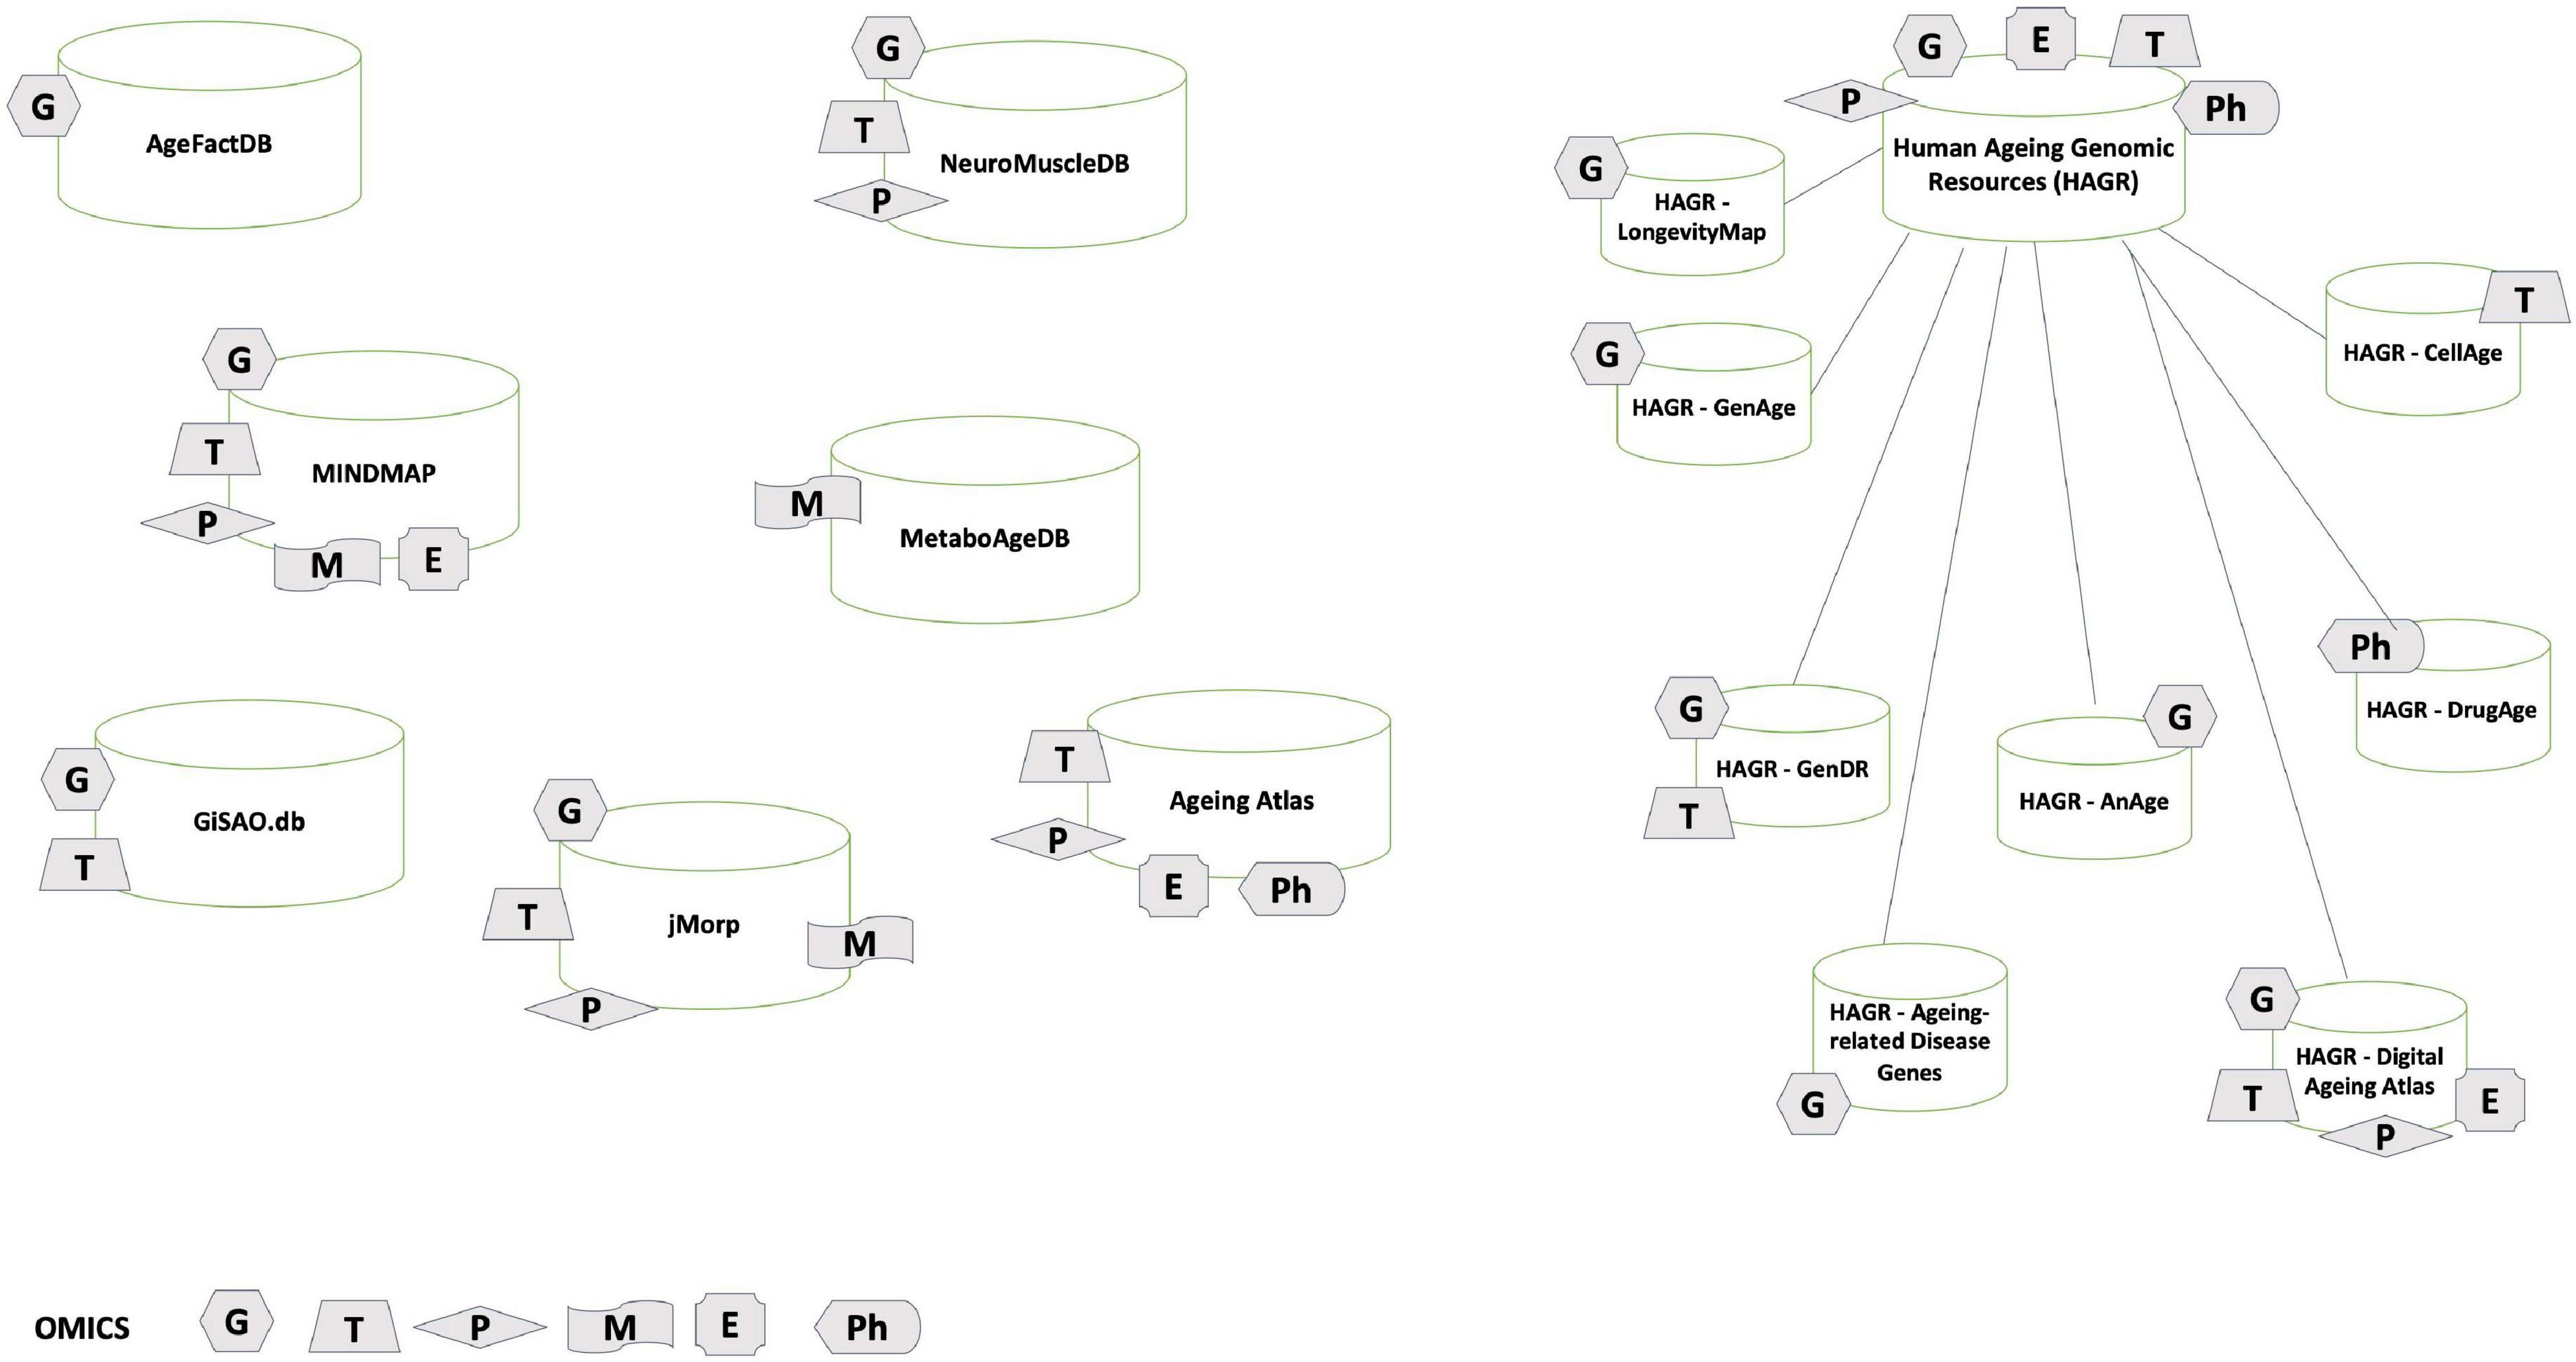 G stands for genomics; T for transcriptomics; P for proteomics; M for metabolomics; E for epigenomics; Ph for pharmacogenomics.
Here is another overview of the table above:
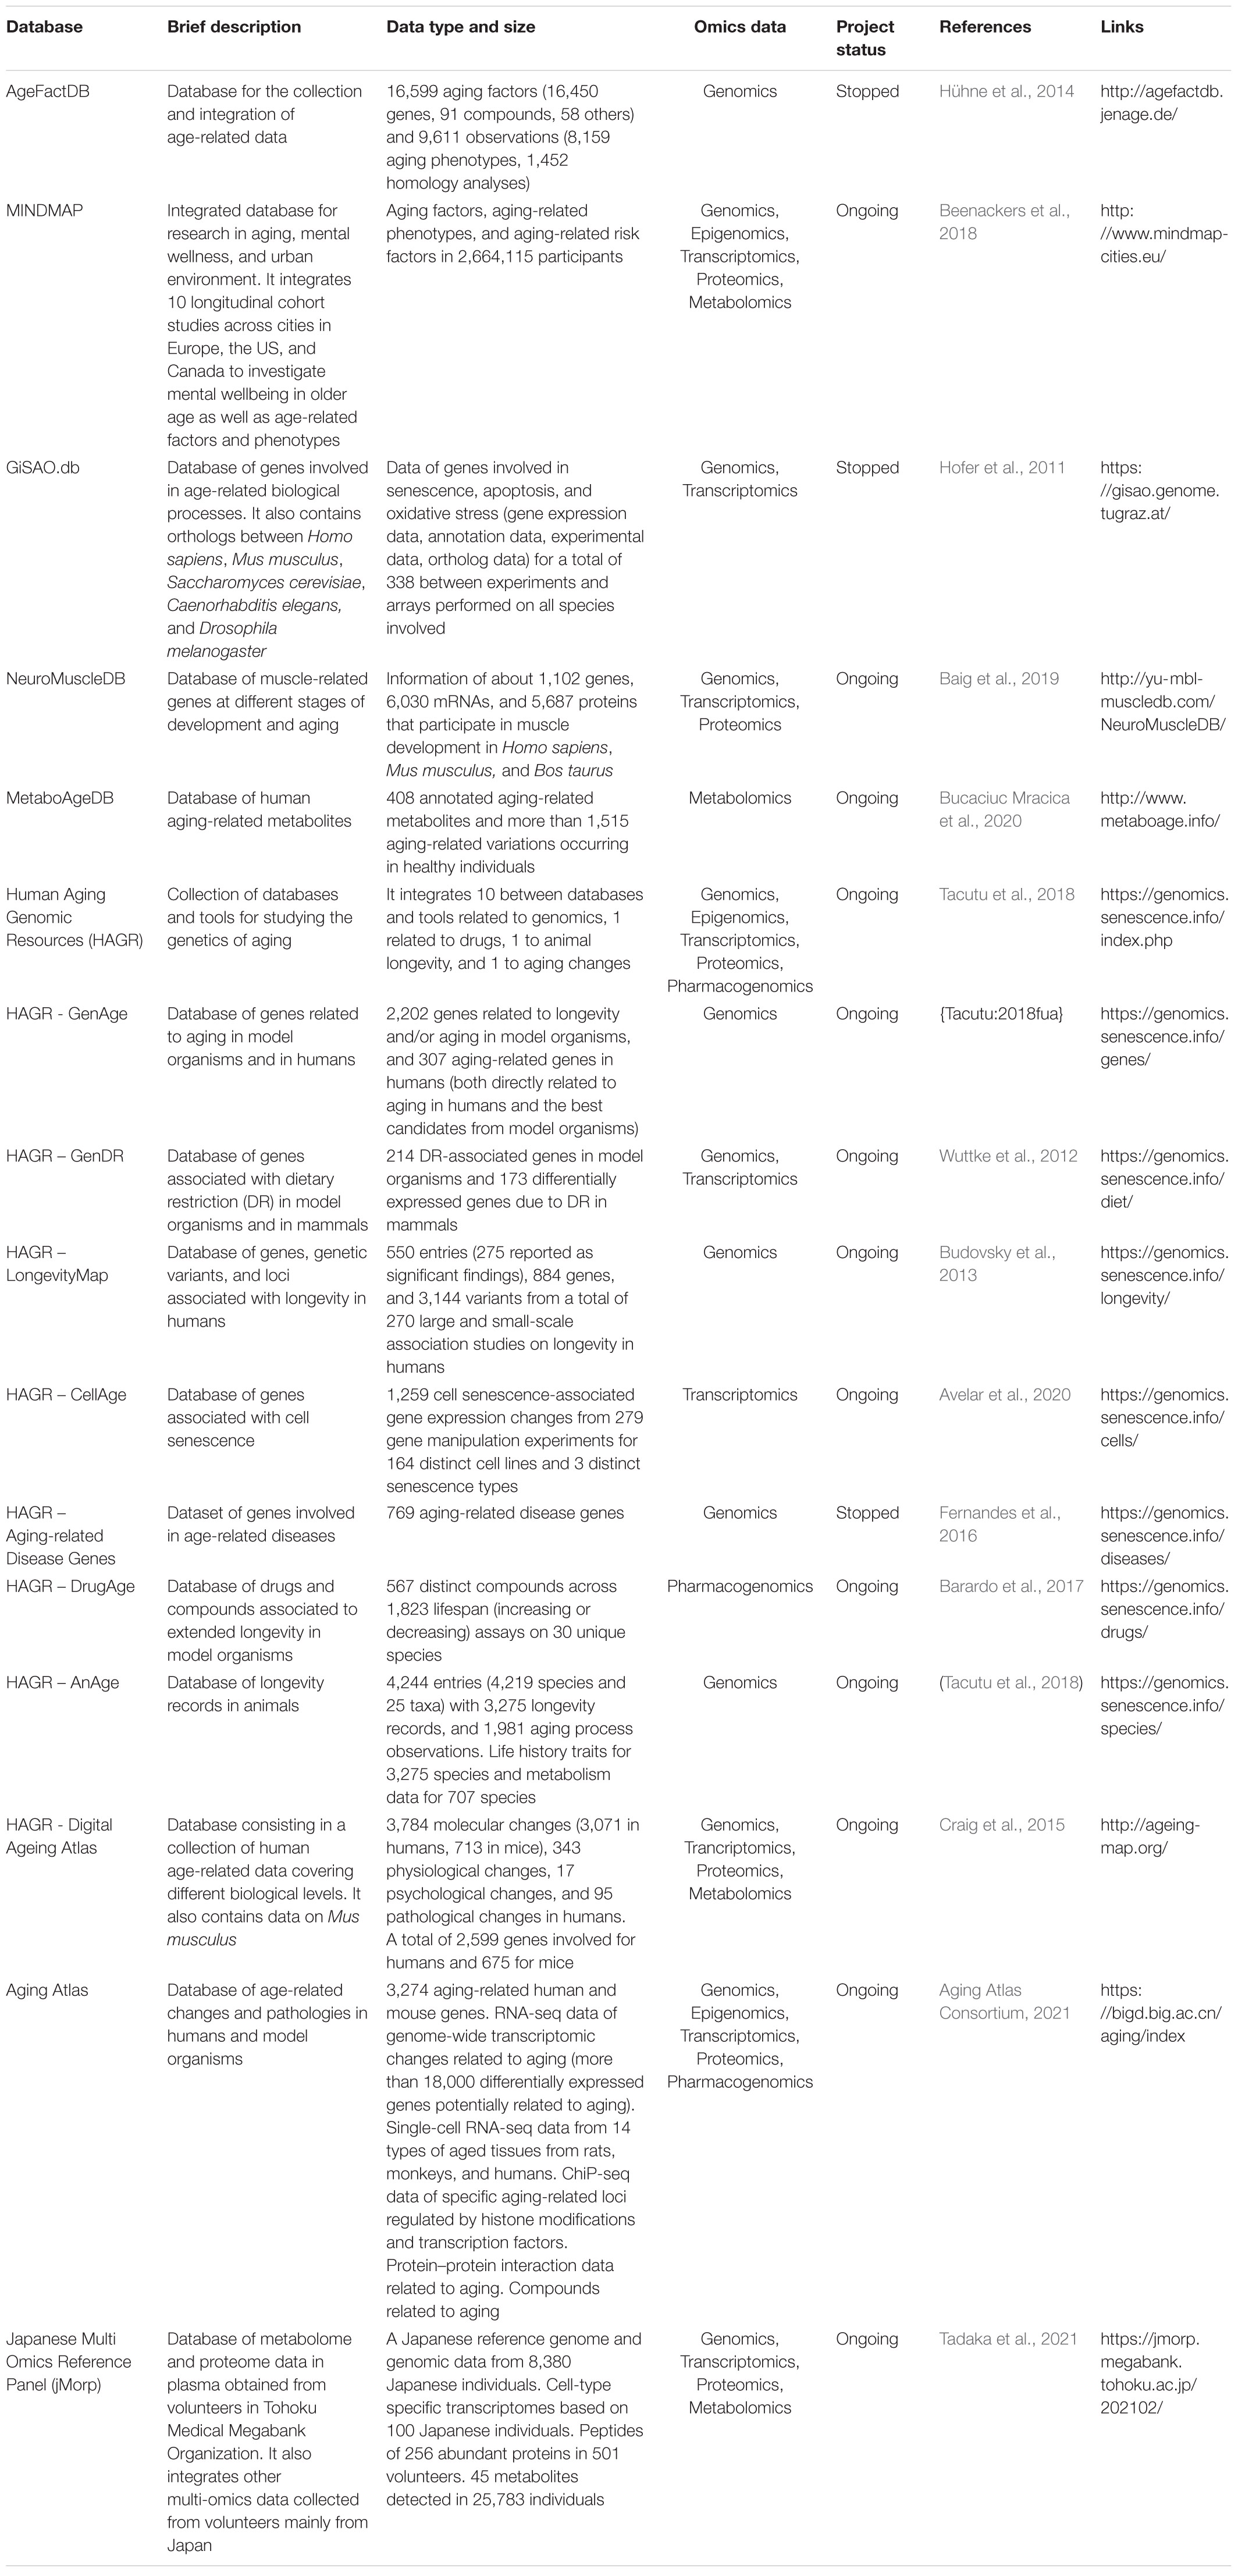
The AgeFactDB, also known as the JenAge Aging Factor Database, is a repository that collects and integrates aging phenotype data, including lifespan information (Hühne et al., 2014). The database focuses on “aging factors,” which are genes, chemical compounds, environmental factors, or lifestyle factors (such as diet) that can affect lifespan and/or other aging phenotypes. In order to be included in the database, an aging factor must be compared to a control in at least two different experimental setups (for example, experiments with and without a chemical compound, experiments with different concentrations of a compound, experiments with dietary restriction or overfeeding compared to a normal diet, etc.). When an aging factor is defined, each piece of information linked to the effects of that factor is called an “observation” and represents evidence of its effects on aging. The AgeFactDB provides unique IDs to identify aging factors and observations (AF_nnnnnn and OB_nnnnnn, respectively).
One major challenge in data integration is the fact that different data sources often have different data structures, which requires a large amount of manual curation to integrate them. The AgeFactDB attempts to address this challenge by providing aging phenotype information in two formats: Type 1, which includes observations within a single description, and Type 2, which separates lifespan data into different fields (e.g., lifespan effect, lifespan change, and lifespan value). Another important issue for all databases is data validation. By comparing a list of observations sorted by the percentage change in lifespan to a qualitative classification (increased, decreased, or no statistically significant effect), the AgeFactDB is able to identify a number of inconsistencies. The database can be accessed either by browsing through predefined lists or by searching using synonyms, PubMed IDs, and Medical Subject Headings, choosing among multiple source databases, specific types of aging-relevant evidence, or AgeFactDB IDs. More details are available in Hühne et al. (2014).
The MINDMAP is a database infrastructure that promotes research on aging and manages the mental well-being and cognitive function of older individuals (Beenackers et al., 2018). Mental disorders in old age are associated with impairments in social functioning, decreased quality of life, and an increased risk of health problems and comorbidities, making them a key priority for public health policy and prevention (Whiteford et al., 2013). The aim of the database is to integrate urban environmental characteristics from longitudinal studies in 11 countries covering over 35 cities. The integration of these data is useful for evaluating the interaction between the environment and individual determinants of cognitive aging. The strength of the MINDMAP is its ability to combine data from multiple cities and from different sources (physical, social, and socioeconomic environmental characteristics, policy indicators), allowing for the identification of high-risk population subgroups and the study of relatively rare health conditions. As with other databases, the harmonization of data from different studies remains a key challenge: to harmonize all MINDMAP cohort studies, each research team focuses on a specific domain of information (e.g., socioeconomic variables, multimorbidities, health behavior variables, etc.). The database has restrictive data sharing rules, with a central server running RStudio allowing authenticated investigators to securely access firewall-protected data on primary and secondary data servers. More details are available in Beenackers et al. (2018).
The NeuroMuscleDB is a database of genes associated with muscle development, neuromuscular diseases, aging, and neurodegeneration (Baig et al., 2019). The aim of the database is to help develop strategies to prevent muscle loss in the elderly, which is one of the major contributors to neuromuscular diseases and neurodegeneration and affects mortality in old age (Listrat et al., 2016). The database aims to help translate the findings of different studies into clinical interventions. To this end, NeuroMuscleDB integrates results from muscle-associated genes that are directly or indirectly involved in aging and age-associated neurodegenerative diseases. The database can be updated manually or systematically, by incorporating new data and resources. A strength of this database is that it also includes analytical tools for PCR primer design and sequence analysis to support the laboratory analysis of candidate genes and sequences. More details are available in Baig et al. (2019).
Molecular studies on metabolic variations during aging can inform lifestyle changes and medical interventions aimed at improving healthspan and lifespan (Lorusso et al., 2018). However, none of the currently available aging-related databases are specialized in aging metabolomics. The MetaboAgeDB is a source of known age-related metabolic changes from studies of disease-free human cohorts (Bucaciuc Mracica et al., 2020). Aging-sensitive metabolites, extracted from well-known databases, are annotated with their chemical information, variations between age groups, and links to the metabolic pathways in which they are involved, including their effects on aging and the gender(s) in which these effects can be seen. This information is easily accessible through individual pages that include an “Age-variations” panel, in which gender-specific and method-specific metabolite variations are visually represented, grouped by the type of age-related variation. For each metabolite, a summary table provides an overview of the units of measurement, the method of detection, the age range and sex of the experimental group, and information about the pathways in which the metabolite is involved. In addition, the MetaboAge entry provides users with easy access to external links through a user-friendly web interface. More details are available in Bucaciuc Mracica et al. (2020).
The Human Ageing Genomic Resources (HAGR) is a collection of databases and tools designed to help researchers interested in the genetics of human aging, integrating results from different approaches such as functional genomics, network analysis, systems biology, and evolutionary analysis. The project is supported and maintained by the Integrative Genomics of Ageing Group at the University of Liverpool in the United Kingdom. This big data repository is divided into several sections, which are briefly described below.
A major resource within HAGR is GenAge, the database of genes related to longevity. It is divided into two sections: the section on human aging-related genes includes the few genes directly related to aging in humans, as well as the best candidate genes obtained from model organisms (yeast, worms, flies, mice, etc.), clustered according to functional groups (Tacutu et al., 2018). As of the last update in February 2020, the database included 307 human genes belonging to 15,054 Gene Ontology categories. The developers of GenAge claim to have constructed and analyzed the first protein network of human aging, as well as developed a system-level interpretation of aging.
Complementary to GenAge is LongevityMap, a database of human genetic variants associated with longevity (Weber et al., 2016). LongevityMap is a repository of genetic association studies of longevity that includes both positive and negative association results to provide visitors with as much information as possible regarding each gene and variant previously studied in the context of longevity. Users can search LongevityMap by chromosome, by gene or genetic variant (e.g., refSNP number), by gene name or HGNC symbol, or by topic (such as age-related disease) in LibAge (Tacutu et al., 2013). LongevityMap also provides a link to AnAge (De Magalhães et al., 2009), the Database of Animal Aging and Longevity, a repository developed for comparative biology studies that provides researchers with quantitative data on life history and lifespan. The database, featuring over 4,000 species, contains life history records of organisms that are accessible through the AnAge browser and divided into three branches (animals, plants, and fungi). The most important trait in AnAge is maximum longevity, as it is the most widely used parameter for comparing rates of aging between species. Factors that can bias longevity records, such as population size and whether animals are kept in captivity, are also considered. Each entry has a qualifier indicating the confidence placed in the longevity data. This qualifier is based on the reliability of the original reference from which maximum longevity was obtained, the sample size, whether a given species has been studied and reproduces in captivity, and whether there are any conflicting reports. Confidence in the longevity data is hence classified as: “low” (only used for species without an established maximum longevity in AnAge), “questionable,” “acceptable,” and “high.” The database can be queried or a zipped tab-delimited dataset of the latest stable build, containing only raw data, can be downloaded.
The Digital Aging Atlas (DAA) is a centralized collection of aging changes and pathologies (Aging Atlas Consortium, 2021). Maintained by the Aging Atlas Consortium, the database integrates molecular, physiological, psychological, and pathological age-related data, including anatomical models. Although primarily focused on human aging, the DAA also includes supplementary mouse data, particularly gene expression data, to enhance and expand the information on human aging. The genetic information in the DAA is also extensive, with 2,599 human genes and 675 mouse genes linked to age-related diseases or traits.
Authors of this study conducted also the parsing of the the database of Genotypes and Phenotypes (dbGaP17) and the European Genome-Phenome Archive (EGA18) which resulted in additional longevity data sources.
The first repository we scanned for relevant data has been the database of Genotypes and Phenotypes (dbGaP17). DbGaP includes data from sequencing studies and large-scale genomic studies, as well as genotype, phenotype, exposure, expression array, epigenomic, and pedigree data from GWAS.
European Genome-Phenome Archive (EGA18). The EGA is an online repository for the storage and sharing of genetic and phenotypic data from biomedical studies.
There in their supplementary material 1 they have outlined which additional data can be used to investigate aging related questions.
One of the central tasks regarding the data above would be constructing an integrative longevity graph database, something along the lines that was done with the PrimeKG project. If one were to manage to integrate all the afromentioned data in a huge GraphDB, then it would be possible to investigate longevity in a personalized manner.
With the specified databases, lets turn concretely on the individual (and integrated) omics approaches and see what kind of longevity related questions can be asked and answered.
Genomics approach in longevity#

For a general overview of computational genomics, please refer to this course.
One of the main question we want to answer is: What are genomic regions that have causal effect on aging (phenotype)?
To understand Genome-wide association studies (GWAS) from a computational perspective please refer to this source.
Genome-wide association studies (GWAS) are a common approach for examining the relationship between genetic variants and specific phenotypes. In these studies, genetic variants are determined for individuals from two groups: those with a specific phenotype, such as old age, and those without the phenotype. The frequencies of the observed variants are then compared between the groups and statistically tested for differences, which can suggest an association. The GWAS catalogue, which includes all published GWAS that test at least 100,000 single nucleotide polymorphisms (SNPs) and all SNP-trait associations with p-values less than 1 x 10^-5, provides a curated collection of these studies. These studies have successfully identified novel genes and pathways involved in various complex phenotypes in humans. A curated collection of all published GWAS that assay at least 100,000 single nucleotide polymorphisms (SNPs) and all SNP-trait associations with p-values < 1 ∗ 10−5 (genome-wide suggestive threshold) are published in the GWAS catalogue (Hindorff et al., 2009, https://www.genome.gov/gwastudies/) (see Fig. 1.4 for the map on longevity).
Genome-wide association studies (GWAS) have been used to examine the association of genetic variants across the entire genome of a species with a specific phenotype, such as old age. These studies have identified novel genes and pathways involved in complex phenotypes in humans. In GWAS, genetic variants are determined for individuals from two groups: those with the phenotype in question and those without the phenotype. The frequencies of the observed variants are compared between the groups and tested for differences, which can imply association. Based on twin and population studies, the genetic contribution to longevity in humans has been estimated to be 15-30%, with larger contributions to survival past 65 and 85 years at 36% and 40%, respectively (Murabito et al., 2012). However, these GWAS on longevity have only had limited success so far.
(FHS 100K) Framingham Heart Study 100K project (Lunetta et al., 2007), which found no SNPs reaching genome-wide significance (p-value < 5 ∗ 10−8), albeit a few with modest association. FHS analyzed the genetic data of over 100,000 participants. This study identified several genetic variants associated with longevity, but the effect sizes were small, and the variants only explained a small portion of the genetic contribution to longevity. Since then, several other GWAS studies have been conducted on longevity, but they have also had limited success in identifying genetic variants that are significantly associated with longevity.
One reason for the limited success of GWAS studies on longevity is that the genetic basis of aging is complex and likely involves many different genes and pathways. In addition, the genetic contribution to longevity may vary among different populations and may be influenced by environmental factors. Therefore, it is likely that additional studies with larger sample sizes and more diverse populations will be needed to fully understand the genetic basis of aging and longevity.
In 2013, Deelen et al. compared nonagenarians (people 90 years of age or older) with a younger population and identified the SNP rs2075650 in TOMM40 on chromosome 19 as the only genome-wide significant association (p=3.39 * 10^-17). They found that this SNP had a moderate link with nearby ApoE 4 (r^2 = 0.553) and could not find any APOE-independent effect on longevity. Therefore, they concluded that the effect of the SNP is mediated by APOE. Deelen et al. further expanded on this analysis by using sets of SNPs grouped by pathway in their GWAS, similar to the idea of comparing functionally enriched categories between transcriptomics experiments. Several methods for using sets of SNPs in GWAS analysis had already been developed.
In 2013, Deelen et al. tested the association of two SNP sets with longevity: one set for the IIS pathway and the other for the telomere maintenance pathway. Four different tests consistently showed a significant association of both pathways with human longevity. Beekman et al. (2013) combined genome-wide association studies with genome-wide linkage analyses of long-lived siblings. The study identified four regions that showed linkage with longevity: 14q11.2, 17q11-q22, 19p13.3-p13.11, and 19q13.11-q13.32. The authors created a model that combined this information with a GWAS on a separate population. The combined model demonstrated that the associations of lifespan with the ApoE 4 and ApoE 2 alleles explain the linkage at 19q13.11-q13.32, while the other three linkage regions could not be explained by variants detected in the GWAS for longevity but may be interesting regions to investigate further.
Recent investigations include:
Napolioni et al. showed that consanguinity and autozygosity are associated with an increased risk of late-onset Alzheimer’s Disease, even after controlling for educational attainment and APOE genotypes. They also identified a rare recessive variant in the RPH3AL gene in a group of consanguineous patients with LOAD. Podder et al. used data from several species to identify pathways involved in aging, confirming the role of FoxO signaling, mTOR signaling, and autophagy. They also found that the target proteins of the drug rapamycin were conserved across all four species. Treaster et al. reviewed the use of comparative genomics in understanding the genetic basis of age-related diseases and longevity. Mohammadnejad et al. applied a regulatory network analysis to a group of monozygotic twins to identify genes associated with cognitive function, finding five novel genes and dysregulation in ribosome function and focal adhesion as key pathways in neurodegeneration.
Investigations on this front are further ongoing, and some computational issues with GWAS are outlined here:

One interesting data investigation would be the inclusion of the pangenome.
Inital human genome sequencing wasnt complete, it only covered heterochormatic regions 92% (easier to access) and it didnt touch euchromatin. See here for details.
What if we could conduct analysis on the pangenome, a genome that would account for much broader specter of the population and with that reduce potential errors that arrise from use the standard reference genome?
“Using our draft pangenome to analyze short-read data reduces errors when discovering small variants by 34% and boosts the detected structural variants per haplotype by 104% compared to GRCh38-based workflows, and by 34% compared to using previous diversity sets of genome assemblies.”
Repeating and applying some of the computational analysis might elucidate patterns that werent available in the standard reference genome.
So what can we concluding regarding genomics approach in longevity?
Longevity is a trait that is heritable to some extent, with estimates ranging from 10-30% depending on the factors that are controlled for (Graham Ruby et al. 2018). While examining the role of genetics in longevity, researchers have found that the variance explained is lower, at around 8% (Wright et al. 2019). If you are interested in exploring the potential effects of genetics on your own longevity, you can upload your sequenced genome data to Promethease and search for SNPs (single nucleotide polymorphisms) associated with longevity. Some SNPs, such as rs2802292 and rs2802288, have been shown to increase the odds of living to 100 by up to 1.5 to 3 times, but these effects may vary in different populations. One potential approach to increasing lifespan is to genetically engineer embryos to have beneficial alleles of these SNPs.
Epigenomics approach in longevity#
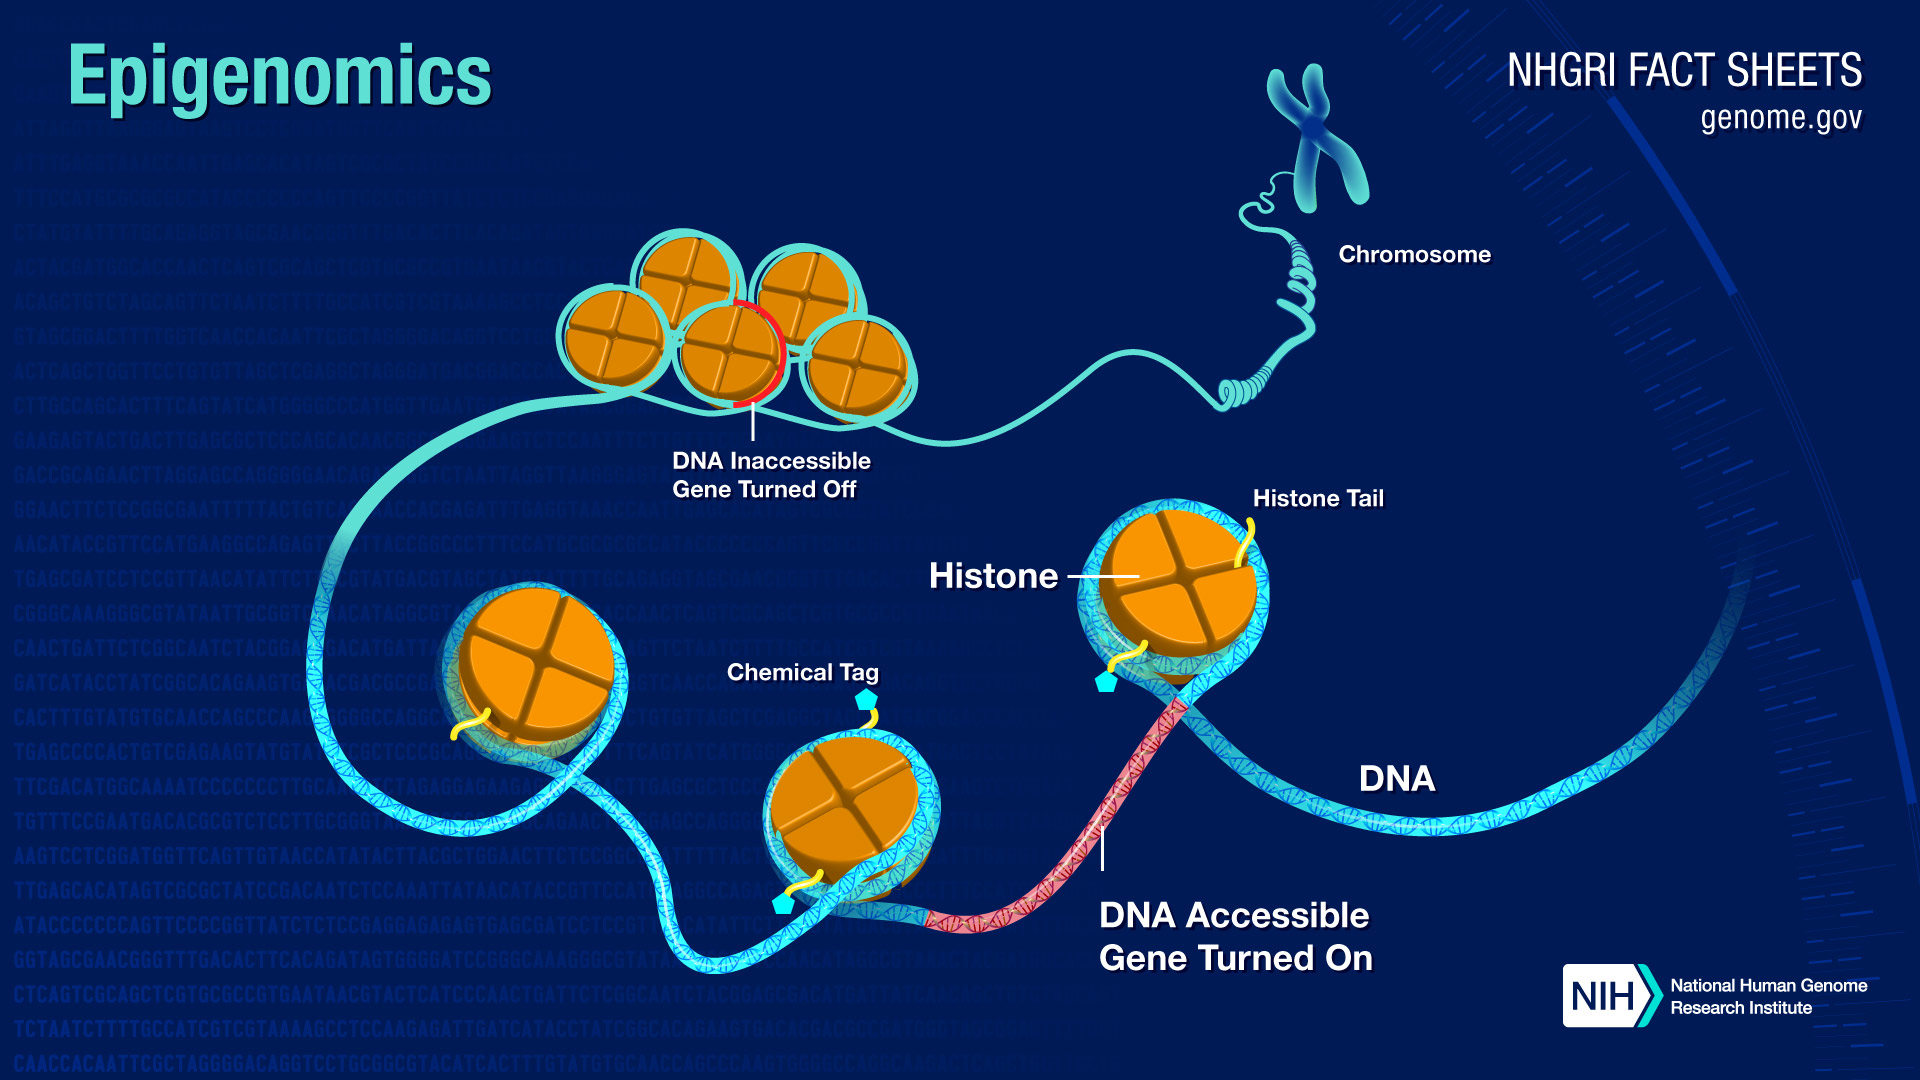
Epigenetic changes are essential for normal biological functioning and can affect natural cycles of cellular death, renewal, and senescence. Lifestyle and behavioral factors such as diet, sleep, exercise, smoking, and alcohol consumption can also affect the composition and location of chemical groups that bind to our DNA. Environmental factors such as stress, trauma, and even neighborhoods or zip codes may also have an impact.
Ageing-associated epigenetic changes include DNA methylation, histone modifications and chromatin remodelling, which together contribute to a general loss of heterochromatin in aged cells.
One of the more prominent examples of epigenomics data is DNA methylation. DNA methylation is the most studied epigenetic mark involved in various processes in human cells, including gene regulation and the development of diseases such as cancer. An increasing number of DNA methylation sequencing datasets from the human genome are produced using various platforms, from methylated DNA precipitation to whole genome bisulfite sequencing. Many of these datasets are fully accessible for repeated analyses.
Consult this free online book a comprehensive overview.
The most prominent example of computational epigenetics in aging are the epigenetic clocks. Epigenetic clocks are powerful biomarkers based on DNA methylation that were developed to track aging in population studies, clinical trials, and personal health applications.
Transcriptomics approach in longevity#
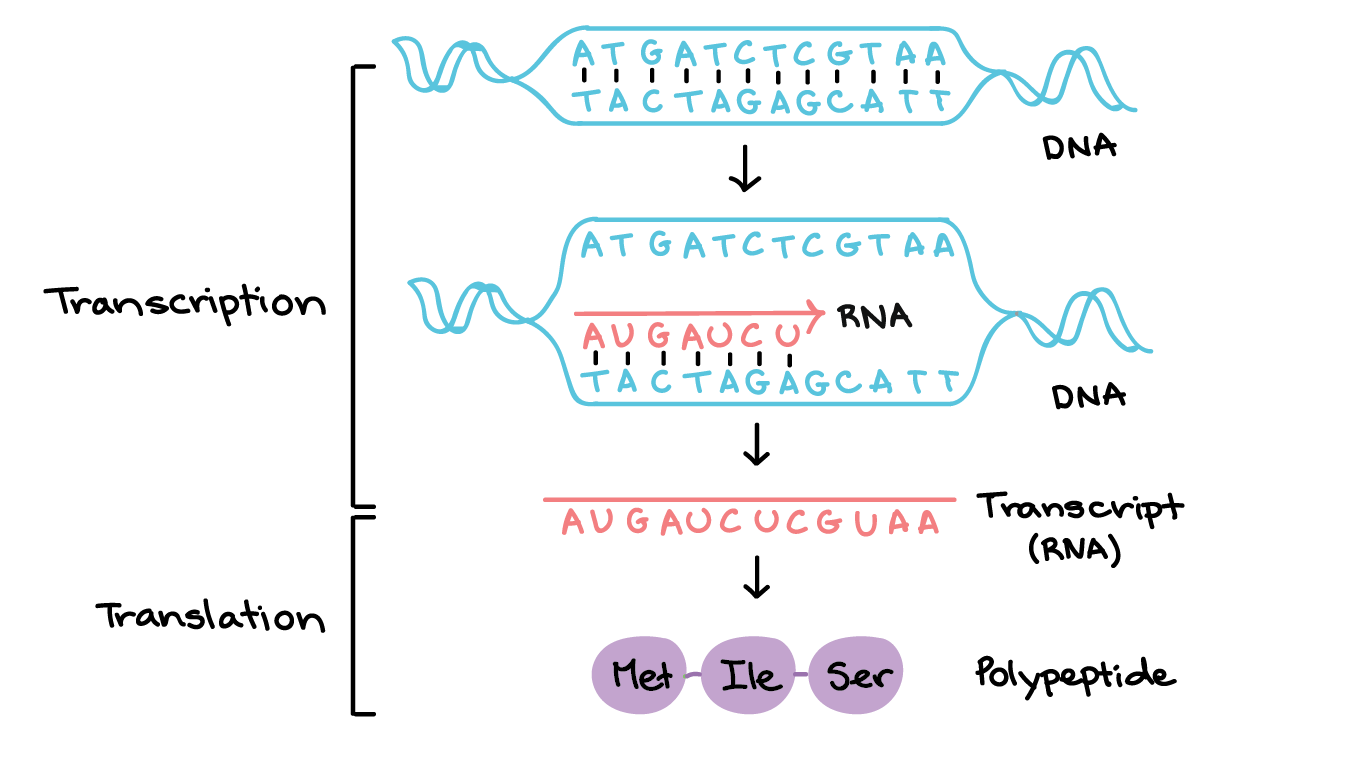
As with previous elements, as we are moving through the central dogma of biology and encountering different steps in the processes, we are quantifying them. Here, concretely, we have defined what transcriptomics is, but what does it mean to quantify it?
Quantifying transcriptomics means quantifying gene expression.
Another definition that we need when performing statistical analyis on gene expression:
A gene is declared differentially expressed if an observed difference or change in read counts or expression levels between two experimental conditions is statistically significant.
Gene expression analysis has been widely used in research on aging (Girardot et al., 2006; McElwee et al., 2007; Pletcher et al., 2002; Selman et al., 2009; Zahn et al., 2007) due to the widespread availability and decreasing cost of microarrays. However, RNA sequencing, which has increased sensitivity, is gaining popularity and is expected to replace microarrays in the future. Currently, the higher costs and less established protocols for RNA sequencing are limiting its use. In microarray experiments, the goal is to identify differences in gene expression between two or more conditions, such as normal and disease, different ages, or long-lived and normal-lived cohorts. RNA is prepared and hybridized to the arrays, and raw binding data is read out using fluorescence imaging. The images are then converted into numerical readouts and analyzed using bioinformatics (detailed in Gentleman et al. (2005, chapters 2, 4, 12-15)). Briefly, the raw numerical readout is background-corrected and normalized within the array and among arrays to eliminate unspecific binding, differences in array production, and other undesired factors, such as different fluorescence properties of the dye. Differentially expressed genes and their statistical significance are then determined using a linear model followed by empirical Bayes analysis, which is implemented in the R package limma (Smyth, 2005).
One example of using gene expression analysis in aging research is comparing two well-known long-lived mutant mice strains (Ames dwarf mice Prop1df/df and Little mice Ghrhrlit/lit) with the WT or heterozygote state, respectively (Amador-Noguez et al., 2004). Using an ANOVA with a p-value ≤ 0.0001, the authors found 1125 and 1152 differentially expressed genes between mutant and control for each strain, respectively. 552 of these genes overlapped between the two mutants. In another study, Landis et al. (2012) used microarrays to study changes in gene expression during aging and in response to various types of stress, including heat stress, oxidative stress, and ionizing radiation. The authors then examined the overlap of these changes and found 18 genes that were upregulated across all conditions. In a different approach, Spindler & Mote (2007) used microarray profiles to compare long-term and short-term DR to the effect of glucoregulatory drugs. They found that metformin produced a similar expression profile to DR in mice and suggested that expression profiles could be used as an easier way of screening drugs compared to lifespan studies.
Functional enrichment analysis and motif analysis are two common approaches used to summarize and interpret large lists of differentially expressed genes. Functional enrichment analysis searches for overrepresented gene annotations, such as GO terms or disease-associations, among the differentially expressed genes compared to the background. Tools such as Catmap (Breslin et al., 2004) and online services such as DAVID (Huang et al., 2009) are readily available for this type of analysis and have been applied in various cases, including comparative studies. Motif analysis, on the other hand, groups genes based on joint transcriptional regulation by the same transcription factor, indicated by shared binding motifs. A list of differentially expressed genes can be searched for over- or under-represented motifs from databases of known motifs, or attempts can be made to identify motifs ab initio. Library-based methods, such as Clover (Frith et al., 2004), are sensitive in detecting weak motifs and include information on which transcription factor corresponds to which motif, if this is known. Ab initio methods, such as NestedMICA (Dogruel et al., 2008), are less sensitive but have the potential to discover novel motifs. An example of a motif analysis is the study of three long-lived mutants (sch9 Δ, ras2 Δ, and tor1 Δ) and wild-type yeast (Cheng et al., 2007), where the authors found a number of enriched motifs, including those that correspond to the transcription factors Fhl1 and Gis1. These transcription factors regulate the expression of ribosomal protein genes and stress-response genes, respectively.
Same as for epigenetics, gene expression can be used to infer (biological) age.
Proteomics approach in longevity#
Proteomics and metabolomics are the profiling of protein and metabolite levels, respectively, using advanced mass spectrometry. In proteomics, the focus can be on different aspects such as relative protein concentrations, protein modifications, and complex formation. Proteomics studies for questions of research on ageing are relatively rare, but their number is increasing (reviewed by Schiffer et al., 2009; Sharov & Schoneich, 2007). One example is the analysis of changes in protein concentration in the long-lived daf-2 mutants in C. elegans (Jones et al., 2010). The authors found changes for proteins related to cellular maintenance and detoxification processes, in agreement with previous transcriptional analyses. A recent study by Depuydt et al. (2013) also analyzed the protein changes in daf-2 mutant in C. elegans and found that general protein synthesis levels, and in particular the abundance of ribosomal subunits, decreased. Interestingly, their analyses found that ribosomal transcript levels were not correlated to actual protein abundance, suggesting that post-transcriptional regulation would determine ribosome content and highlighting the uncertainties in general agreement between transcriptomics and proteomics analyses. Another example of a proteomics study is the study by Robinson et al. (2010), which examined changes in the proteome of Drosophila males reared at two different temperatures over their lifespan. Using liquid chromatography and tandem mass spectrometry, the authors found 33 proteins that shared similar patterns when using scaling time points according to the group’s lifespan, instead of the absolute time points.
For the most recent advances of proteomics and involvement in Aging look here.
Metabolomics approach in longevity#
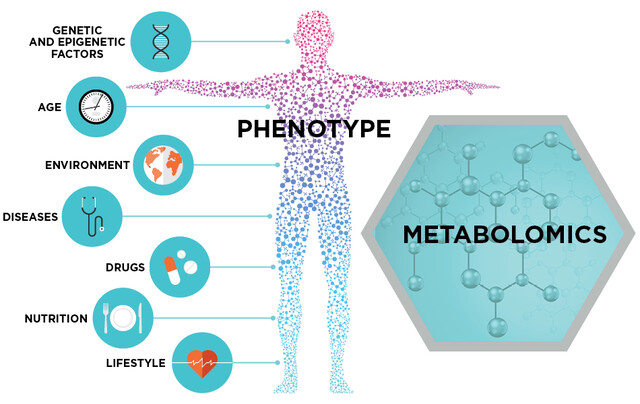
Metabolomics studies on ageing have been conducted to explore the role of metabolites such as glucose and oxygen species in ageing. An example is the analysis of membrane phospholipid composition in long-lived naked mole rats compared to short-lived mice (Mitchell et al., 2007). The statistical analysis of mass spectrometry measurements indicated marked differences between the two species, such as lower levels of docosahexaenoic acid containing phospholipids, which suggests a lower susceptibility to peroxidative damage in membranes of naked mole-rats compared to mice. Yoshida et al. (2010) used metabolic profiling of various yeast mutants and discovered a correlation between the metabolic profiles and yeast replicative lifespan. They further developed a multi-variate model based on the metabolic profiles to predict yeast replicative lifespan. This model allows screening for lifespan mutants in yeast using metabolic profiles as the readout. Using nuclear magnetic resonance, Fuchs et al. (2010) examined the metabolome of various longevity mutants of C. elegans, including daf-2, and found a common metabolic signature, which might indicate that there are hidden connections among diverse longevity mechanisms.
For the most recent advances of Metabolomics Signatures of Aging look here.
Now the question is, how can we reconcile all of these omic approaches, and tackle aging related questions in an unified manner?
Multi-omics approach in longevity#

Aging is considered a multi-factorial trait, highly heterogenous from a genomics point of view, characterized by different levels of complexity ranging from molecular to cellular, organ and organism (Cevenini et al., 2010): in order to be investigated properly, this complexity requires a systems-biology and -omics approach where the integration of multiple data becomes essential.
As already noted, Aging Atlas is a database containing multi-omic data. Good thing about this work is that it not only contains different omics, but allows one to upload, interactively query, jointly analyze, and visualize aging-related omics or single-cell sequencing data.
Omics analysis is a useful technique for investigating the molecular basis of aging. By combining different omics data sets, such as gene expression analysis and genome variations, researchers can gain a more comprehensive understanding of the aging process. For instance, in a study by Wheeler et al. (2009), gene expression in human kidney cells was examined and 630 age-dependent genes were identified, 101 of which contained expression-associated SNPs. This two-staged approach enabled the researchers to detect significant effects more sensitively.
Another example of combining omics data sets is a study by Selman et al. (2006) that used gene expression transcriptomics and metabonomics to investigate the effects of acute dietary restriction in mice. The expression profiles, along with blood plasma metabonomic profiles, indicated that mice undergoing acute dietary restriction rapidly adopted many of the transcriptional and metabolic changes associated with long-term dietary restriction.
The genome of the naked mole rat, a long-lived rodent with a lifespan of more than 30 years, has been sequenced using next-generation sequencing (Kim et al. 2011). This animal has several remarkable characteristics, including negligible senescence, no age-related increase in mortality, high fecundity until death, and resistance to spontaneous and induced cancers. The study by Kim et al. (2011) not only sequenced and assembled the genome, but also predicted genes and gene functions, and analyzed lost and gained genes and their functional categories. Gene expression was measured in brain, liver, and kidney at three different ages using RNA-seq, and differential gene expression analysis revealed few changes between young and old adults compared to other mammals. Overall, the genome and transcriptome data showed distinct patterns of naked mole rat genes compared to humans, mice, and rats, and these patterns may include genes that are important for their different lifespans. For example, the lower expression of IIS genes in the liver of naked mole rats compared to mice may play a role in their longer lifespan.
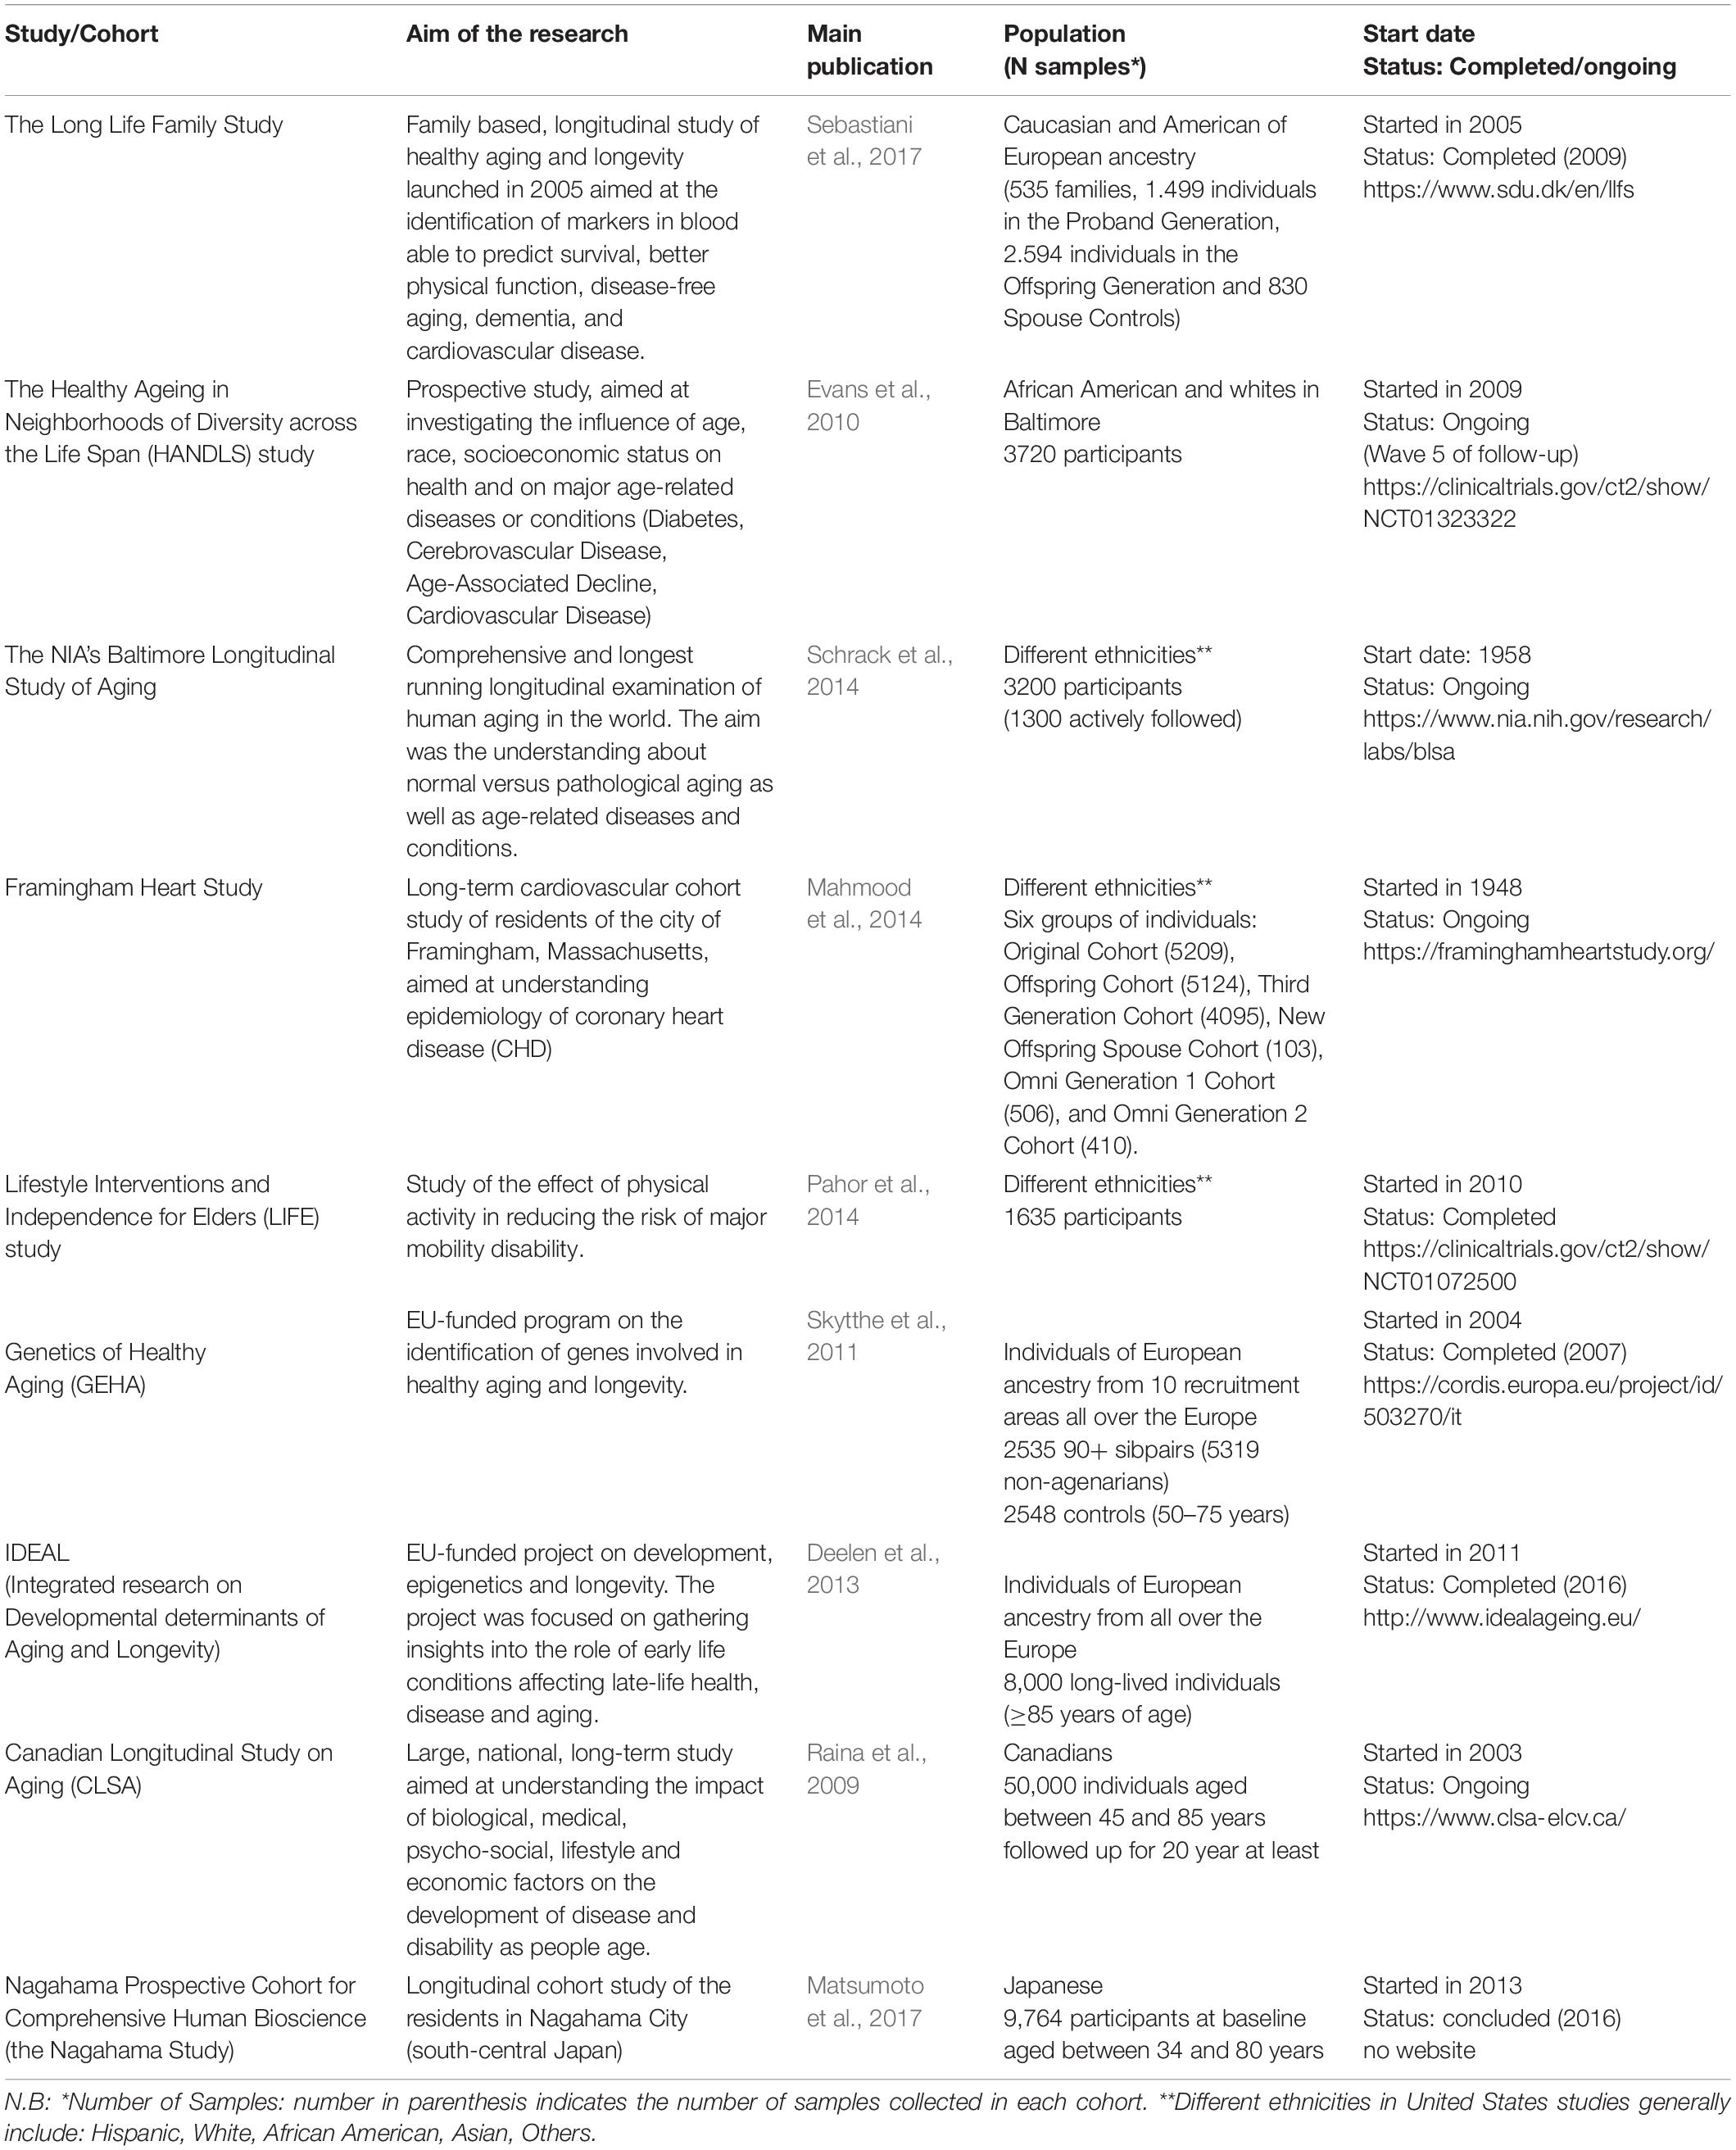
Cohort Aging Studies Collecting Omics Data
A comprehensive overview of all longitudinal studies of aging can be found here.
Longitudinal studies involving the collection of large cohorts of individuals are currently being used to investigate the determinants of aging. Over 70 community-based cohort studies have been conducted, most of them in North America or Northern Europe, and 51 of them have been approved by the National Institute on Aging (NIA) (see) for a complete list). These studies typically include either exclusively elderly individuals or individuals who are at least 50 years old at the time of enrollment, and follow them until their death, with an average follow-up period of 10 years. The collected data typically includes information on family composition, employment, and economic status (socio-demographic variables), self-reported chronic diseases, and functional status, as determined through anthropometric measures and tests of physical performance, measures of cognition, and, in about 60% of the studies, the collection of biological samples. Approximately one third of all the studies also conduct genetic analyses (Seematter-Bagnoud and Santos-Eggimann, 2006). A review of major ongoing cohort and longitudinal studies can be found in Stanziano et al. (2010).
Some of the examples can be seend underneath:
Interesting question would be, can you integrate all of these different studies together, estimate based on the ground truth biological age, which novel biomarkers might be highly relevant for aging. This recent study this exactly this, and the results identified protactive biomarkers against aging, more on it here. There they did integration of lifestyle, laboratory and clinical data. This approach allowed the processing of more than 30 thousand omics markers, confirming and expanding the understanding of mechanisms involved in frailty.
There is one important remark here. Actually asking questions about longevity boils down to asking questions about biology. Hence one of the core issues, such as batch effects, learning joint modalities, etc. become highly important if one were even to start posing longevity related questions.
Said in another words, in order to find meaningfull answers to the questions of the type:
How to integrate longitudinal and spatial multi-omics data to determine biological age?
One needs to start adressing the data science problems inherent to single cell (multi-omics) data source.
Eleven grand challenges in single-cell data science names them, and starting there and repurposing the solutions to elucidate certain hallmark seems like a good way to go.
Network biology approach in longevity#

The premise is that with the explosion of data and the complex intrecacies of the relationships between all of the different (multi-omics) datasets, there needs to be a quantitative way to represent and find these networks of relationship.
In the database chapter I outlined the possibility of building a longevity knowledge graph. If and once this is done, linking a Graph database and software operating on graph structures would allow to pose different node/edge level questions.
Large-scale consortium-based efforts looking at the various aspects of human biology have allowed the application of network-based methods to uncover new insights into the molecular mechanisms of the given phenotype, such as tissue specificity or disease context.
Examples of real world biological networks:
Protein-Protein Interaction Networks (PPIs) This type of networks holds information about how different proteins operate with each other to enable a biological process within a cell. The interactions in a PPI network can be physical or predicted. Notably, a whole interactome can capture all PPIs happening in a cell or an organism. In vivo and in vitro methods for detecting PPIs include: X-ray crystallography, NMR, tandem affinity purification (TAP), affinity chromatography, coimmunoprecipitation, protein arrays, protein fragment complementation, phage display and yeast two-hybrid (Y2H). Widely used repositories (Lehne and Schlitt, 2009; Szklarczyk and Jensen, 2015) which host PPIs for various organisms are the BioGRID (Stark et al., 2006), MINT (Chatr-aryamontri et al., 2007), BIND (Bader et al., 2003), DIP (Xenarios et al., 2000), IntAct (Hermjakob et al., 2004a), and HPRD (Peri et al., 2003) database. Concerning topology, the PPI networks follow a small-world property and are scale-free networks. Central hubs often represent evolutionarily conserved proteins, whereas cliques (fully connected subgraphs) have been found to have a high functional significance (Spirin and Mirny, 2003).
Sequence Similarity Networks (SSNs) These networks consist of nodes representing proteins or genes and edges capturing the sequence similarity between amino acid or nucleotide sequences. Widely used tools (Ekre and Mante, 2016) for obtaining a sequence similarity between two sequences are the BLAST (Altschul et al., 1990), LAST (Kiełbasa et al., 2011), and FASTA3 suite (Pearson, 2000), which contains SSEARCH, GGSEARCH, GLSEARCH executables of Smith-Waterman (Smith and Waterman, 1981) and Needleman-Wunsch (Needleman and Wunsch, 1970) implementations for local and global sequence alignment. These networks are weighted, have a small-world and scale-free topology and often contain hubs. Often, clustering algorithms are applied on such networks for the detection of protein families. Like in PPIs, proteins that lie together in such networks are more likely to have similar functions or be involved in similar biological processes (Sharan et al., 2007). While it is not straightforward to come to a conclusion about their density, when coping with fragmented sequences (e.g., alignments of predicted proteins from metagenomes), the networks are rather sparse.
Gene Regulatory Networks

A gene (or genetic) regulatory network (GRN) is a collection of molecular regulators that interact with each other and with other substances in the cell to govern the gene expression levels of mRNA and proteins which, in turn, determine the function of the cell. They are collections of regulatory relationships between transcription factors (TFs) and TF-binding sites or between genes and their regulators. Normally, these networks are directed, dynamic, and can be visualized as bipartite graphs. In such networks, most nodes have only a few interactions and only a few hubs come with a higher connectivity degree. In any case, such networks follow a power law degree distribution (scale-free) p(k) ~ k−γ, γ ≈ 2 (Vázquez et al., 2004). Among a variety of databases hosting information about gene regulation, widely used repositories are the KEGG (Kanehisa and Goto, 2000), GTRD (Yevshin et al., 2019), TRANSFAC (Matys et al., 2003), TRRUST (Han et al., 2018).
Signal Transduction Networks These networks capture cell signaling or otherwise the transmission of molecular signals as well as a series of molecular events within a cell or from the exterior to its interior (Fabregat et al., 2018). A signal transduction network normally consists of several thousand nodes and edges representing a series of reactions. These networks are mostly directed and sparse. They follow a power law degree distribution as well as small-world properties. While such data can be found in well-known pathway databases (KEGG, Reactome), specialized repositories such as the MiST (signal transduction in microbes) (Ulrich and Zhulin, 2007), NetPath (Kandasamy et al., 2010), or Human-gpDB (Satagopam et al., 2010) also exist.
Metabolic Networks They are networks consisting of metabolites (nodes) and their interactions in an organism. Metabolites can be either smaller molecules such as amino acids or larger macromolecules like polysaccharides. These networks are usually directed graphs and can be represented as Petri nets (Reisig, 1985; Chaouiya, 2007). They are scale-free, they carry small-world properties (Jeong et al., 2000) and can often be organized using hierarchies (Gagneur et al., 2003). In order to gain insights into their decomposition, heuristic modularity optimization over all possible divisions to find the best one is required (Newman and Girvan, 2004). KEGG and Reactome databases are two of the most widely used repositories for this type of network.
Gene Co-expression Networks They are undirected weighted networks where two nodes (genes) are connected if there is a significant co-expression between them. Such networks are usually constructed using data from high-throughput technologies such as Microarrays, RNA-Seq or scRNA-seq. For each pairwise connection, a metric like for example, the Pearson Correlation Coefficient (PCC) (Kirch, 2008) can be used to calculate an edge’s weight. Often, a threshold or a Z-score are applied on the whole network in order to accept correlations above a certain cutoff. Otherwise the network would look like a fully connected clique. After the threshold and depending on the total clustering coefficient, the network can be clustered to detect functional modules. One typical example is the ribosomal genes which tend to group together due to similar expression patterns. Expression data for such analyses can be found in widely used repositories such as GEO (Barrett et al., 2013) or ArrayExpress (Parkinson et al., 2007). Notably, Arena-Idb (Bonnici et al., 2018) repository can be used for human non-coding RNAs interactions.
Potential applications of network biology:
Clustering — finding families and centralities inside big graphs
Network Alignment — In today’s multi-Omics era, integration of heterogeneous information (e.g., transcriptomics, proteomics, metabolomics, etc.) in a multi-layered network structure is becoming a trend. Additionally, methods to directly compare networks and their topological features are gaining ground. To address these issues, network alignment, or alternatively graph isomorphism approaches can be used. Notably, graph alignment is not a trivial task as it is computationally expensive and has been characterized as NP-complete (Zampelli et al., 2010). The concept behind network alignment is to highlight conserved or missing nodes and edges across two (pairwise) or more (multiple) networks.
Link prediction — Besides network alignment, predicting link changes in a single network has recently drawn attention in the biomedical field. Link prediction might concern the creation of future edges or the identification of missing links (e.g., incomplete data). While link prediction techniques are widely used by social media, in biological networks, they have also been used to identify potential drug side effects, protein-protein interactions, disease phenotypes based on molecular information and phylogenetic relations. For example, its application on bipartite graphs has unraveled new drug-target interactions (Kunegis et al., 2013).
Network Perturbation — In biology, direct comparisons between a disease and a healthy state are very common, thus making the study of molecular changes essential. Therefore, at a network level, changes between such states are considered as biological network perturbations. In network medicine, a network’s topology can be used as the backbone to further predict side effects in a system even at a 65–80% success rate (Santolini and Barabási, 2018).
How to construct and the perform graph topology analysis in order to extract insight:
